Table of Contents
Introduction
Customers can access and browse through our image catalog and products through the EarthPlatform. In addition to providing useful metadata and details about the listed images, it provides capabilities to interact with them. You can access the EarthPlatform here.
Search
EarthPlatform has a search panel with various customization options. Let’s have a look at them.
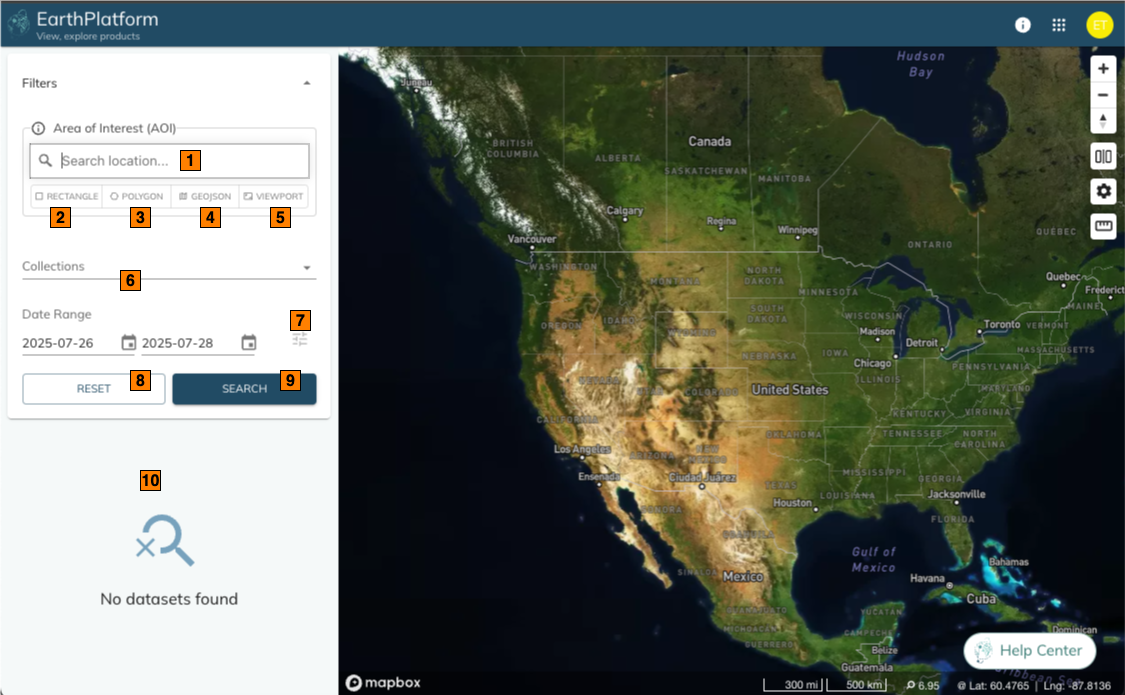
Once you login with your credentials, the landing page for EarthPlatform is shown. On the left hand side, you can find the search filters and search results panel:
| S. No | Label | Description |
|---|---|---|
 | Search Box | Enter any geographic area like “Vancouver”, “Chile” etc to find and focus. |
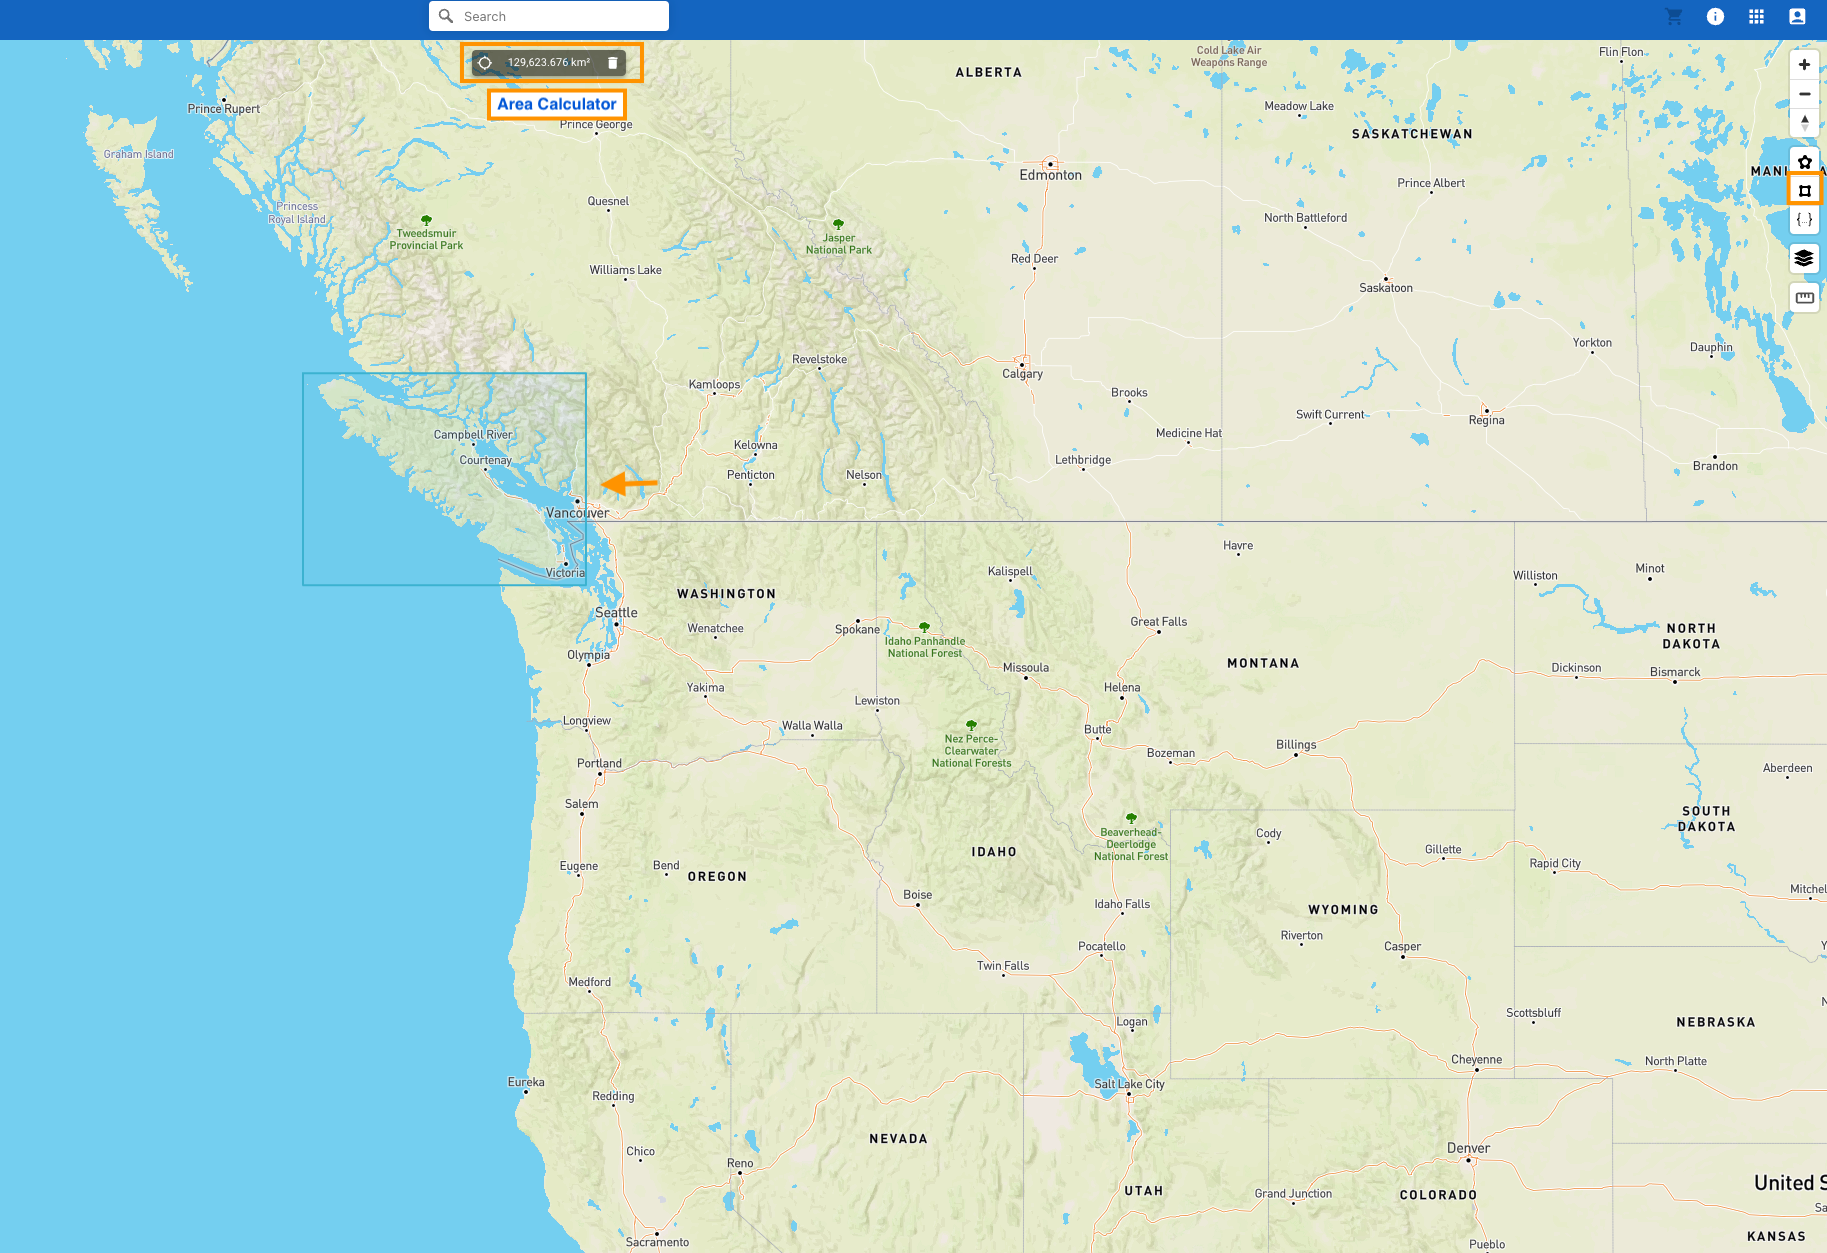
 | Rectangle Tool | Select two vertices of the diagonal on the map to form a rectangular area as a geospatial filter. |
 | Polygon Tool | Select a given area as a geospatial filter on the map by creating a vertex as and when you do a left click. Make sure you click the first vertex of the polygon or double-click after creating the last vertex to complete it. |
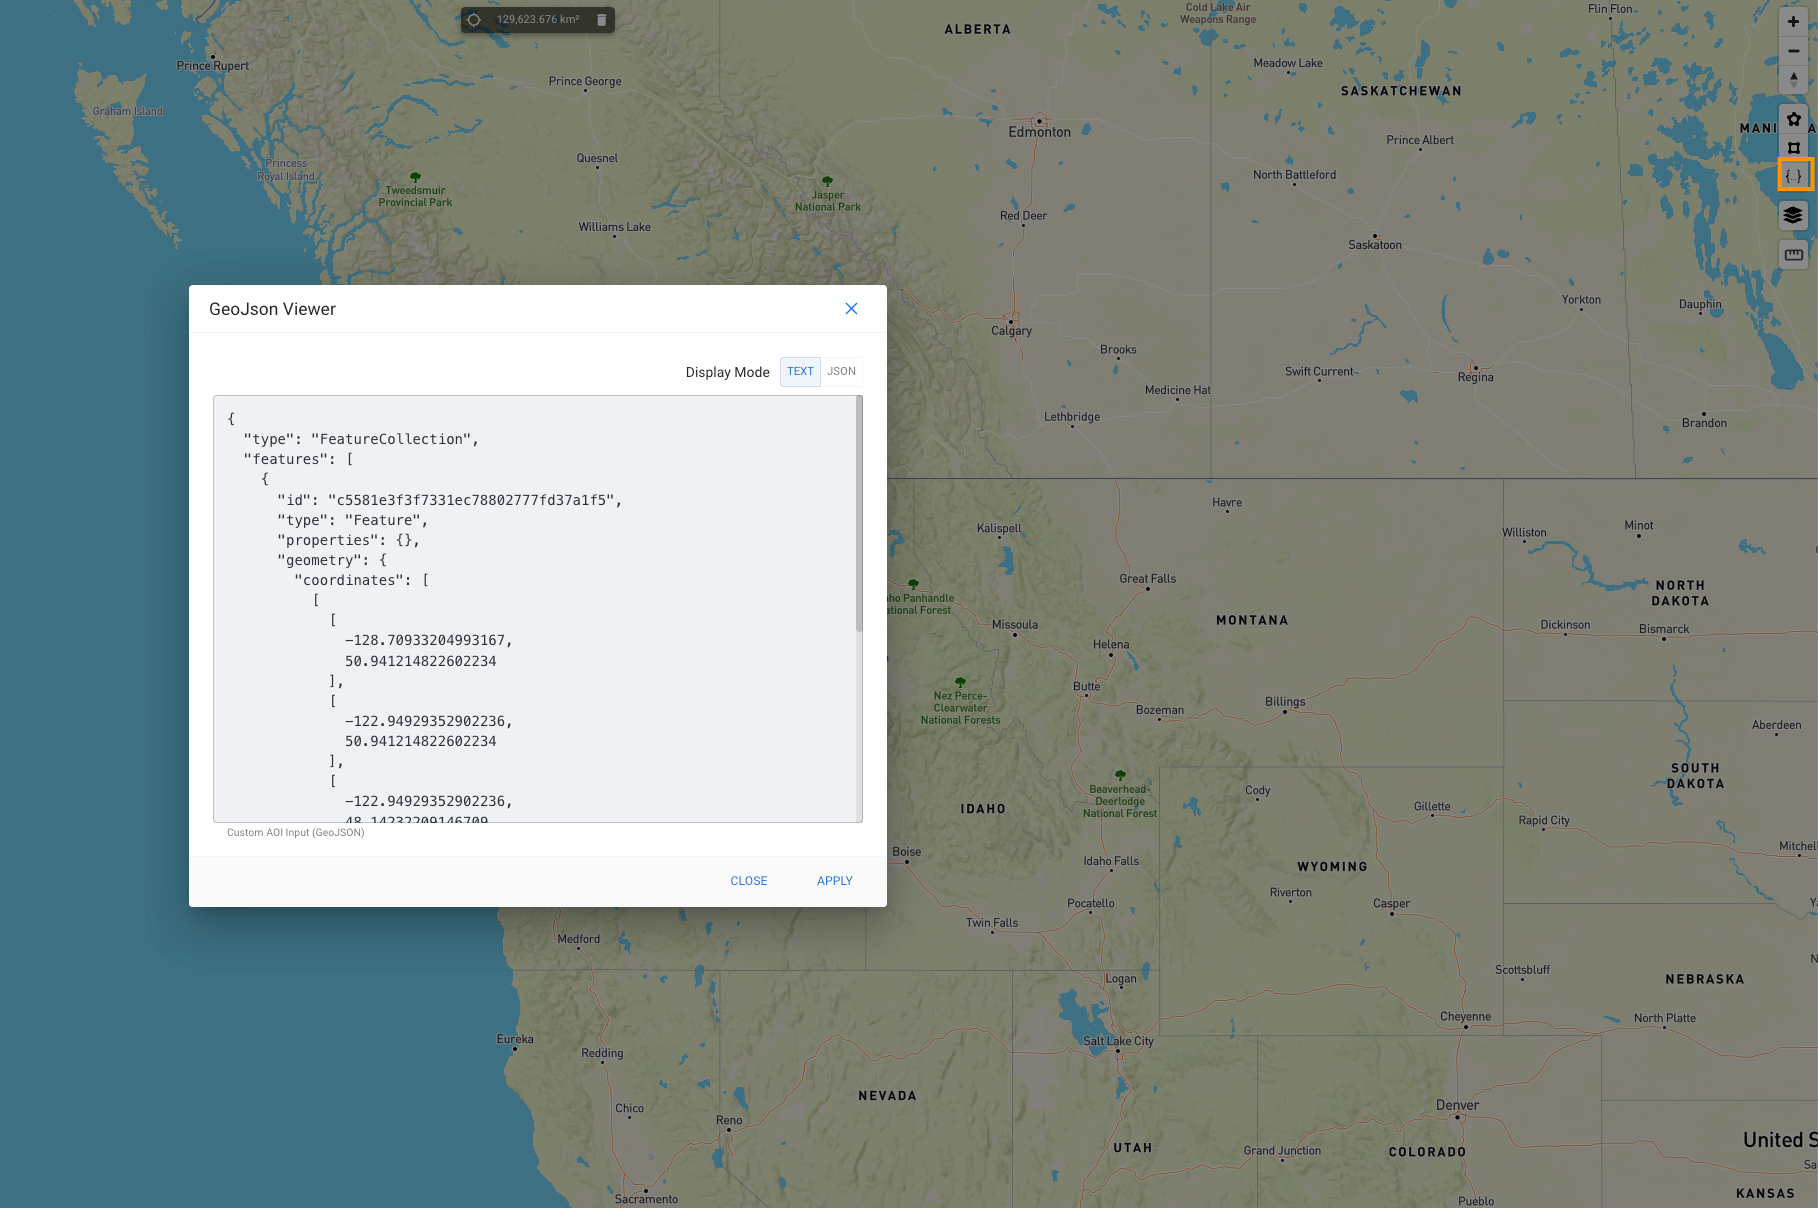
 | Input GeoJSON | Click this button if you have a GeoJson you wish to enter or import as a geospatial filter. |
 | Viewport | Select this to define the current map extents as a geospatial filter. |
 | Basic Filters | Select one or more Collections (up to 15) from the list and define a date range as your basic search filters. |
 | Advanced Filters | Click on the Advanced Filters icon to define additional filters based on the Collections selected. |
 | Reset Button | Click to reset all search filters. |
 | Search Button | Click to submit the search. |
 | Results Panel | This is the area where you would see the thumbnails of the search results for your images. |
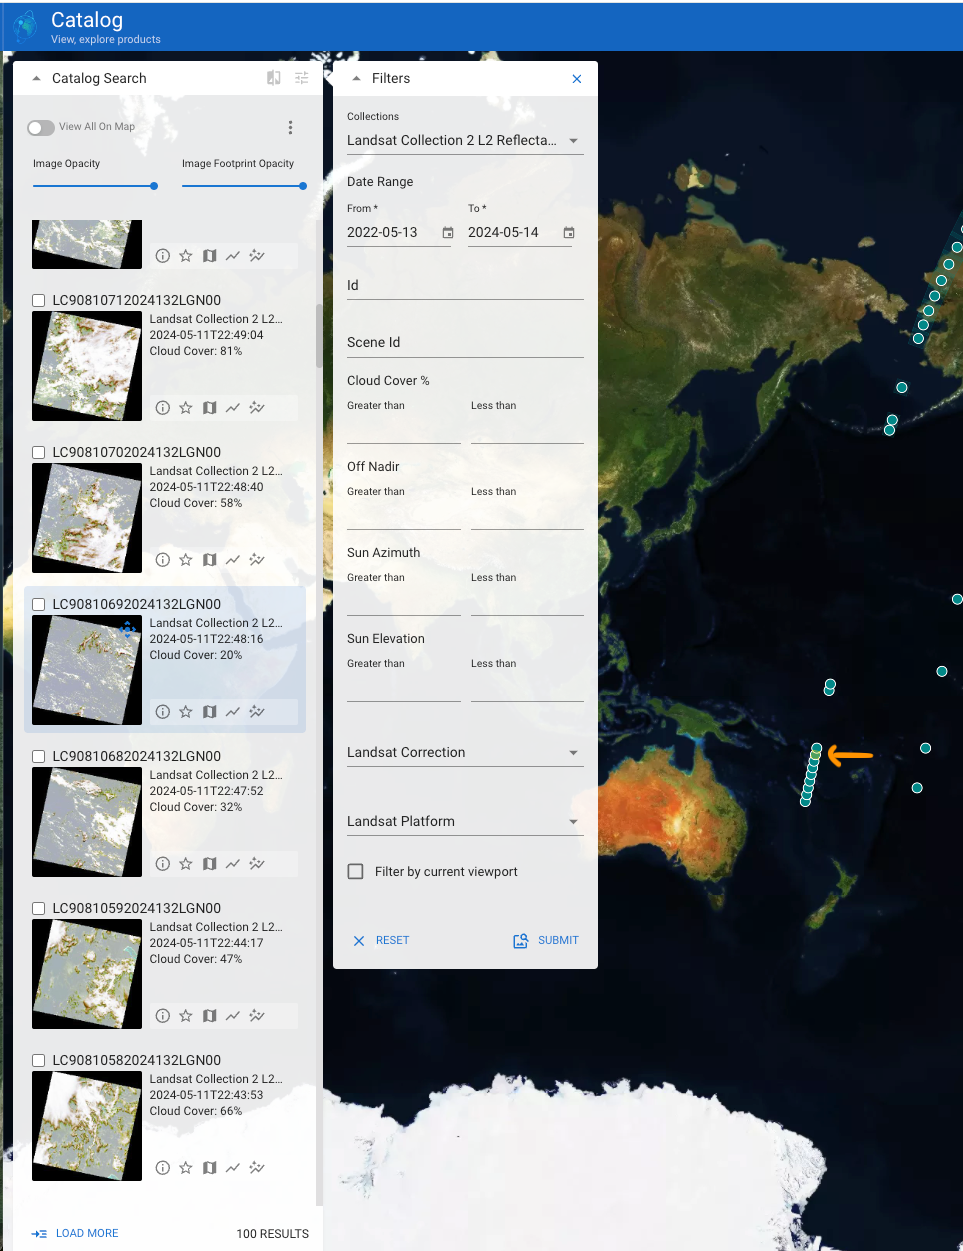
NOTE : The Advanced Filters panel expands with additional parameters based on the Collection selected, as shown below. When there are results returned from the search, you can see the results panel populated with images, along with thumbnails if available. When you hover over a search result, the corresponding footprint will be highlighted in yellow on the map.
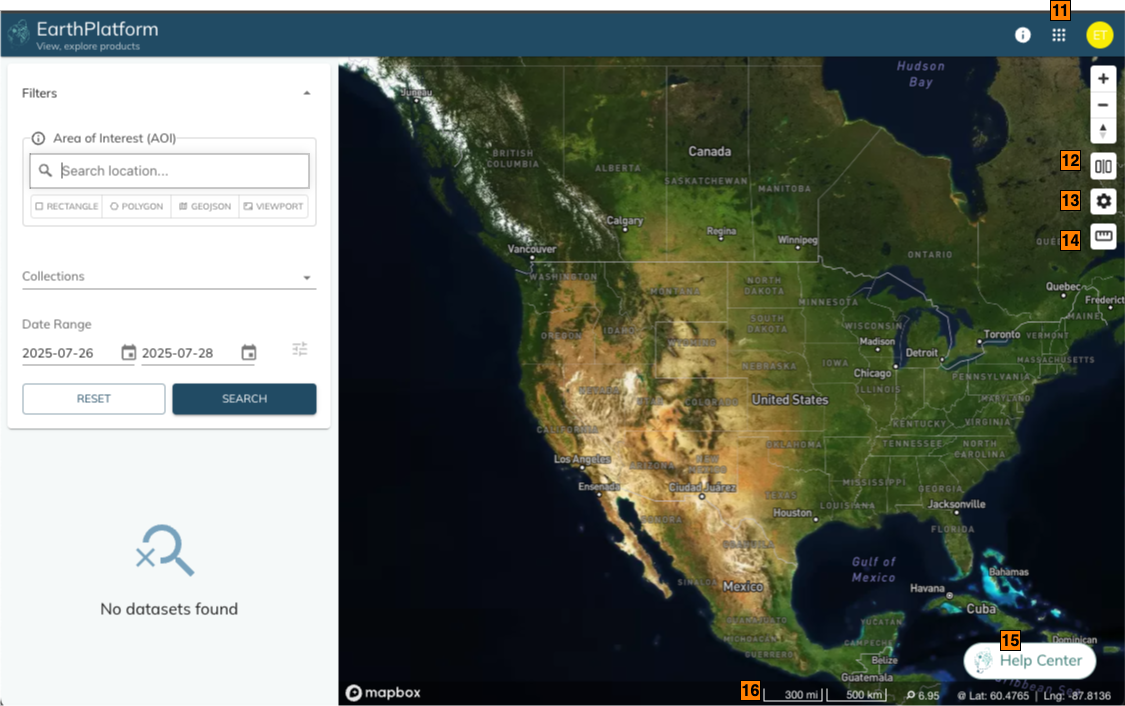
On the right hand side is the map, where you can define the Area of Interest (AOI) and see the footprints of the search results:
| S. No | Label | Description |
|---|---|---|
 | App Switcher | Click this button to switch to another EDA-hosted application. |
 | Map Slider | Click to enable the Map Slider to enter the image comparison mode. |
 | Settings | Click to change base map layers, map projection, and units. |
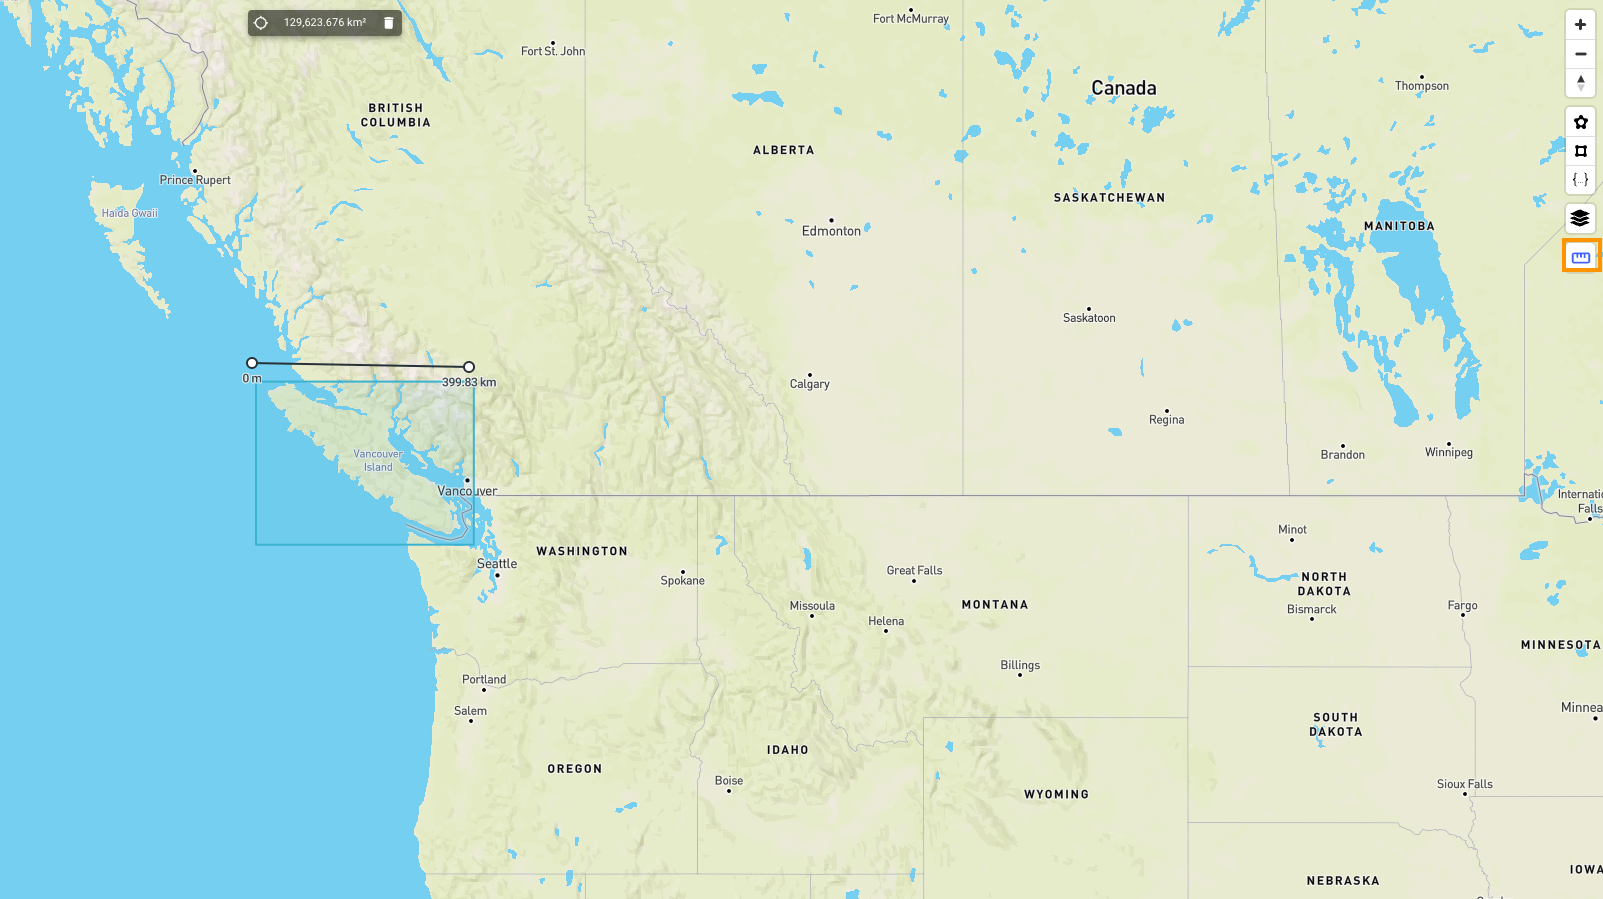
 | Ruler | Click to draw a line and measure the distance between 2 points. |
 | Help Center | Click to report an issue, contact us, or access the documentation. |
 | Bottom Panel | Shows latitude and longitude of current cursor position, current map zoom level, and the map scale bar. |
Below are some images that will give you an idea of how the various controls work.
GeoJSON Viewer and Importer
Streets and Satellite Views
| Streets View | Satellite & Streets View |
|---|---|
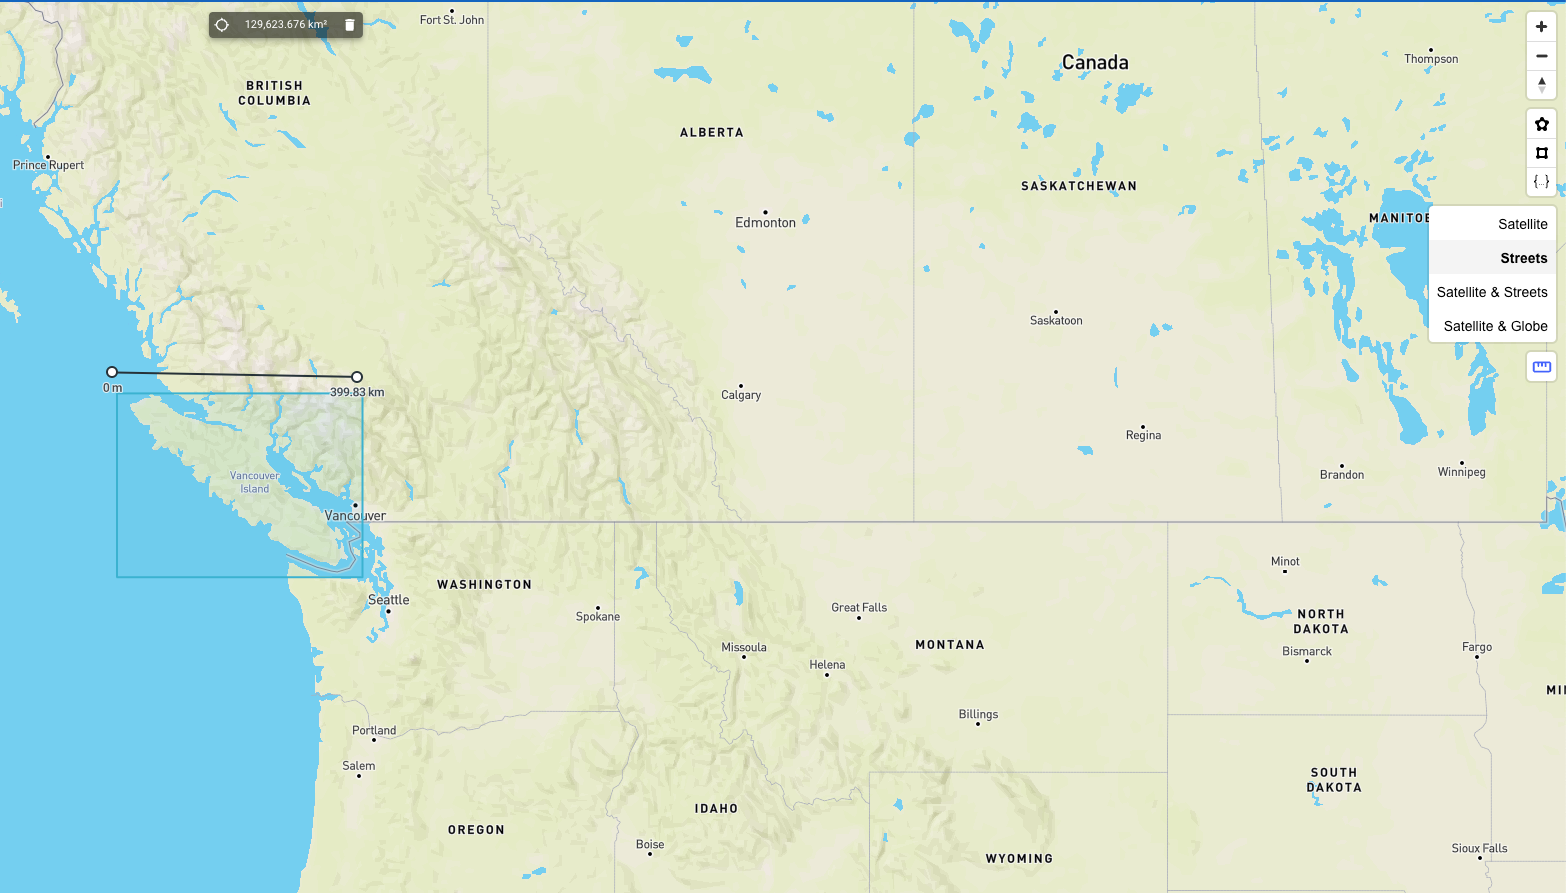 | 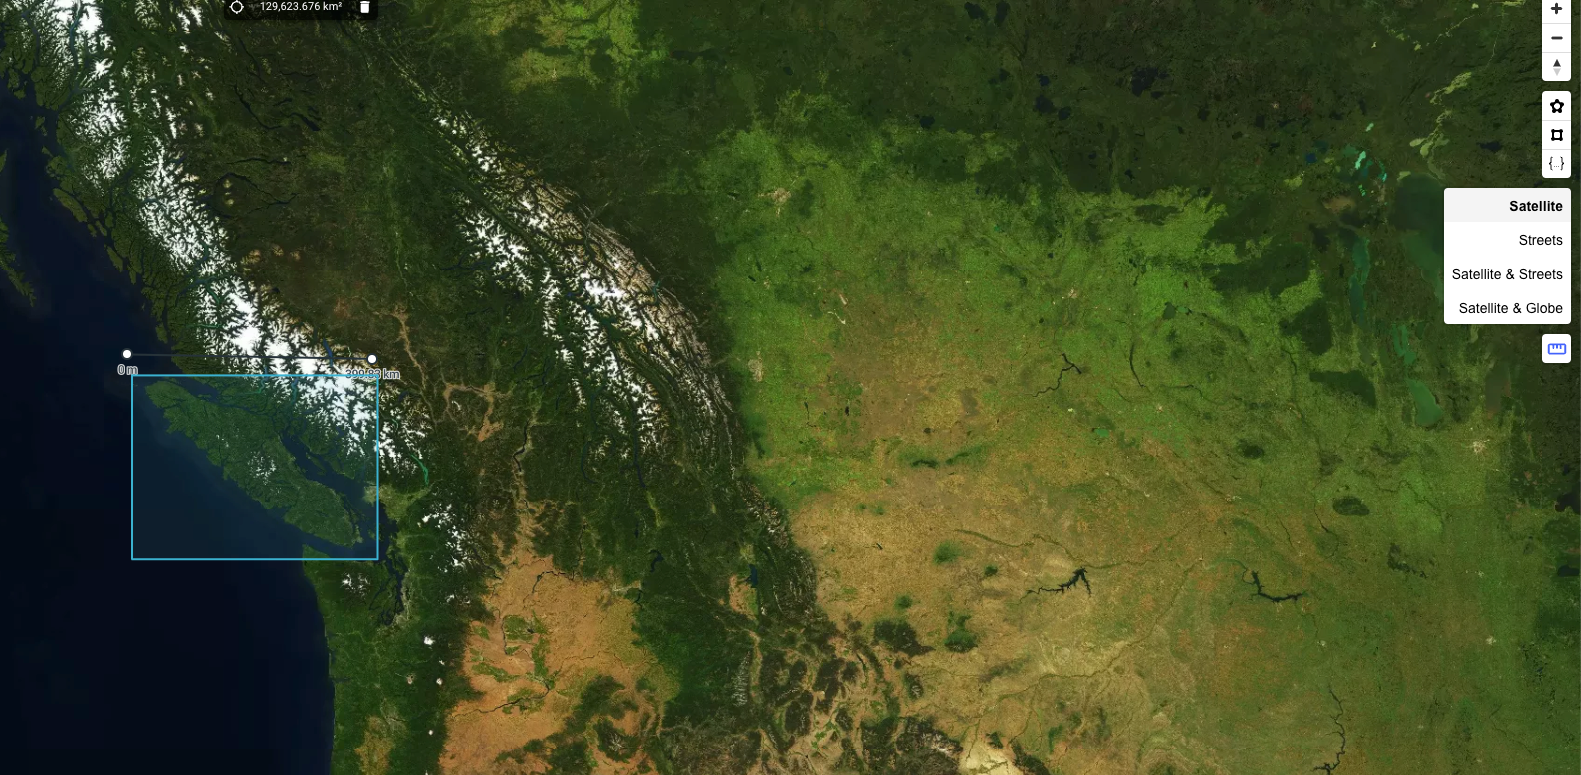 |
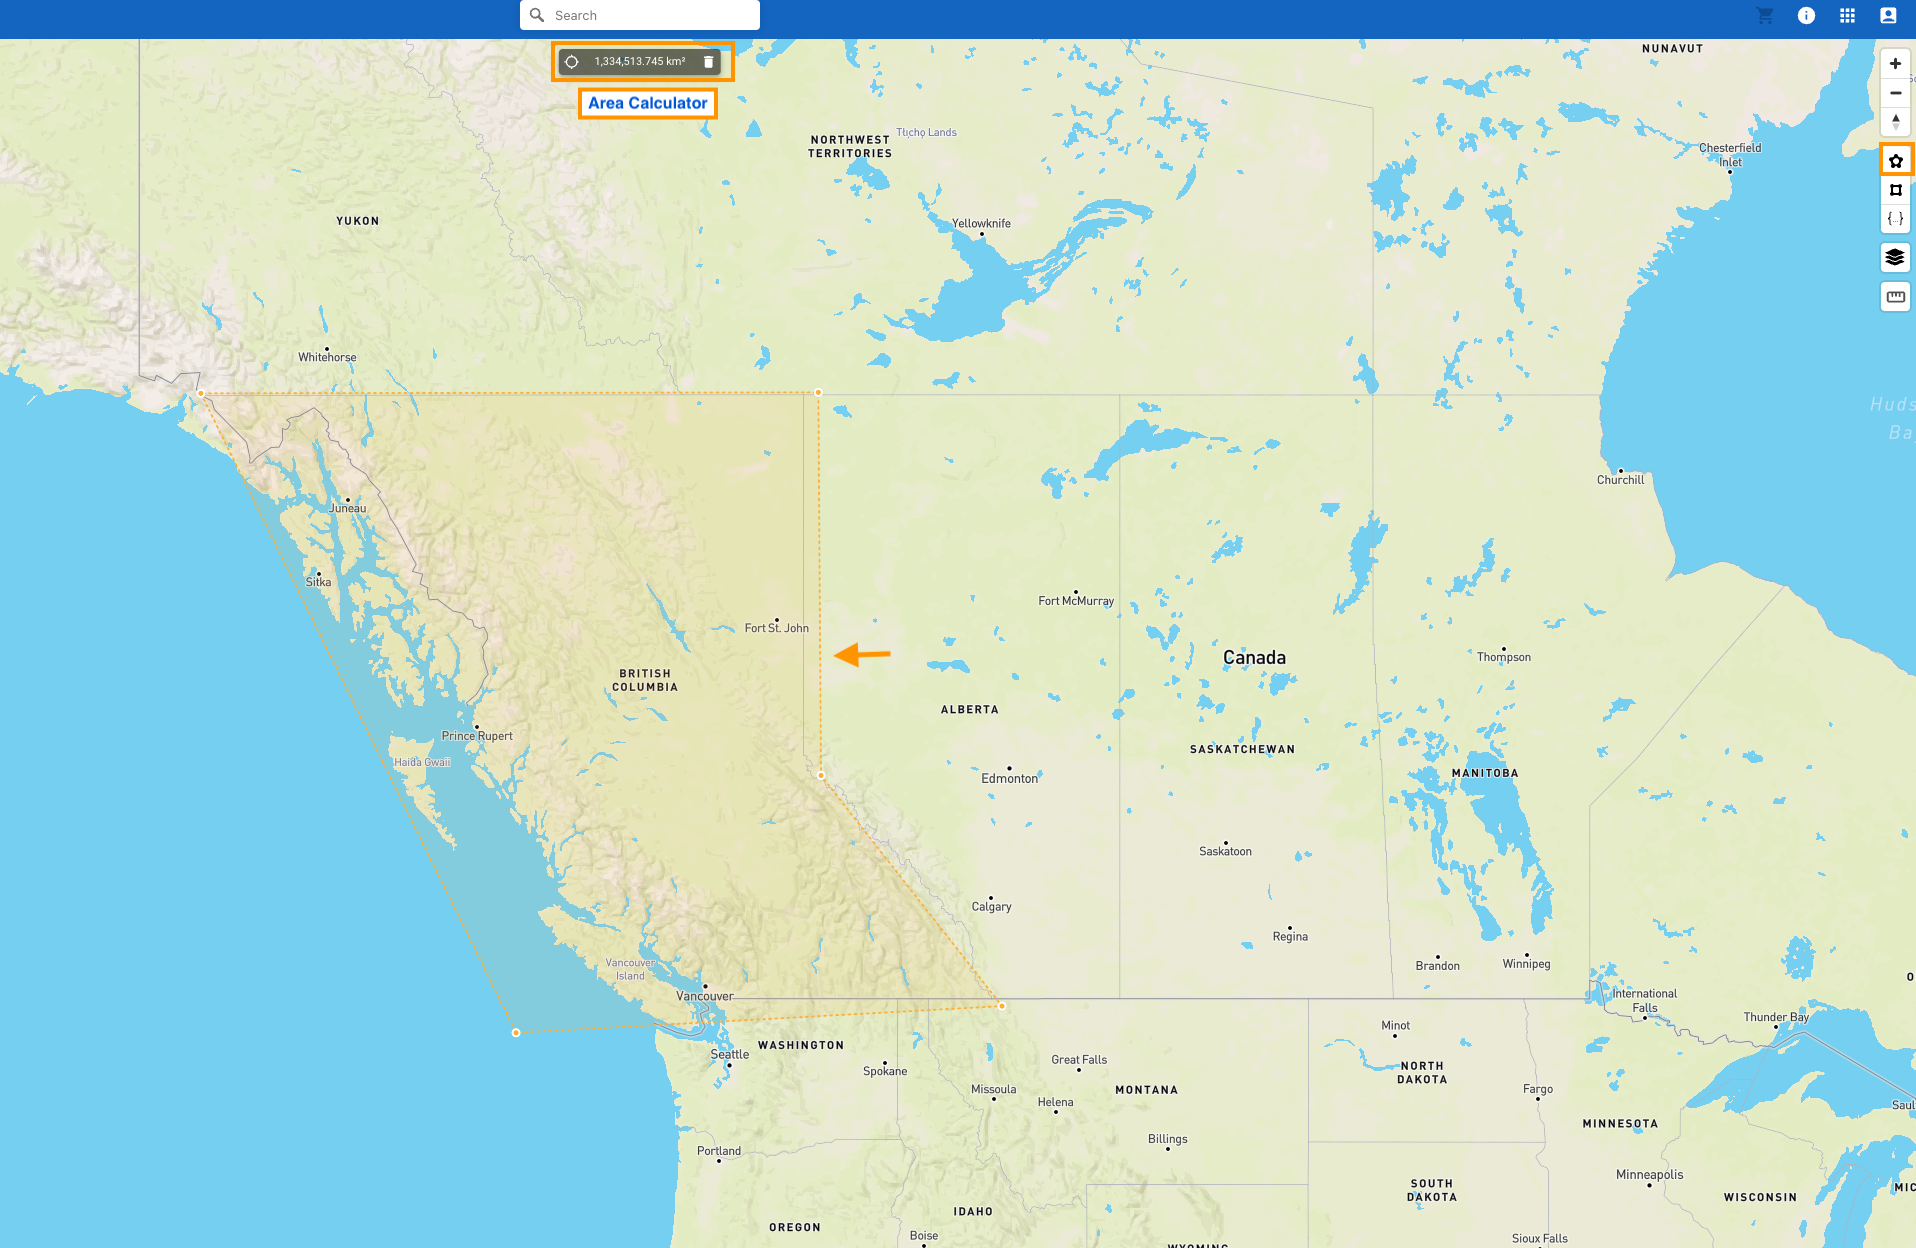
Ruler
Interacting with the catalog
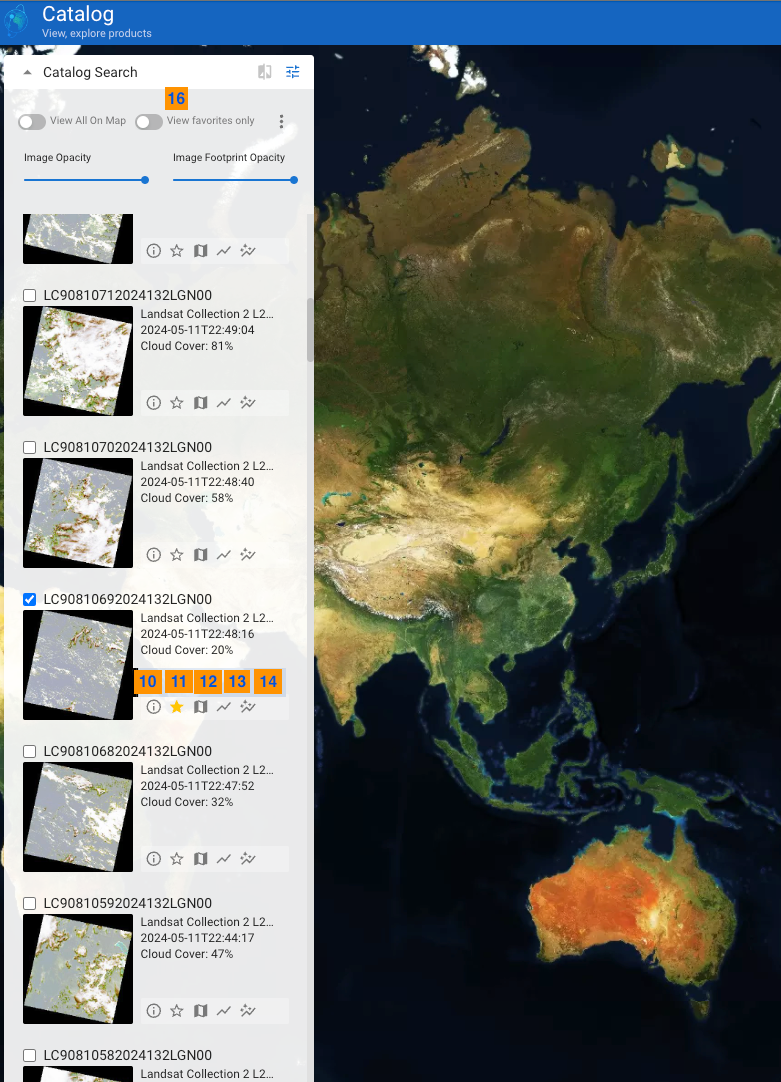
Now let’s see once you have the search results, what you can do with those images. As you can see below, you can click different icons to perform actions on them. There is also a small checkbox for you to select multiple items and then perform actions on them.
| S. No. | Label | Description |
|---|---|---|
 | Show Item Properties | Show the Item Properties on the right hand side panel. |
 | Favorite Item | Tag the image as favorite, and then use the toggle button on top (#26) to show only the items tagged as favorites. |
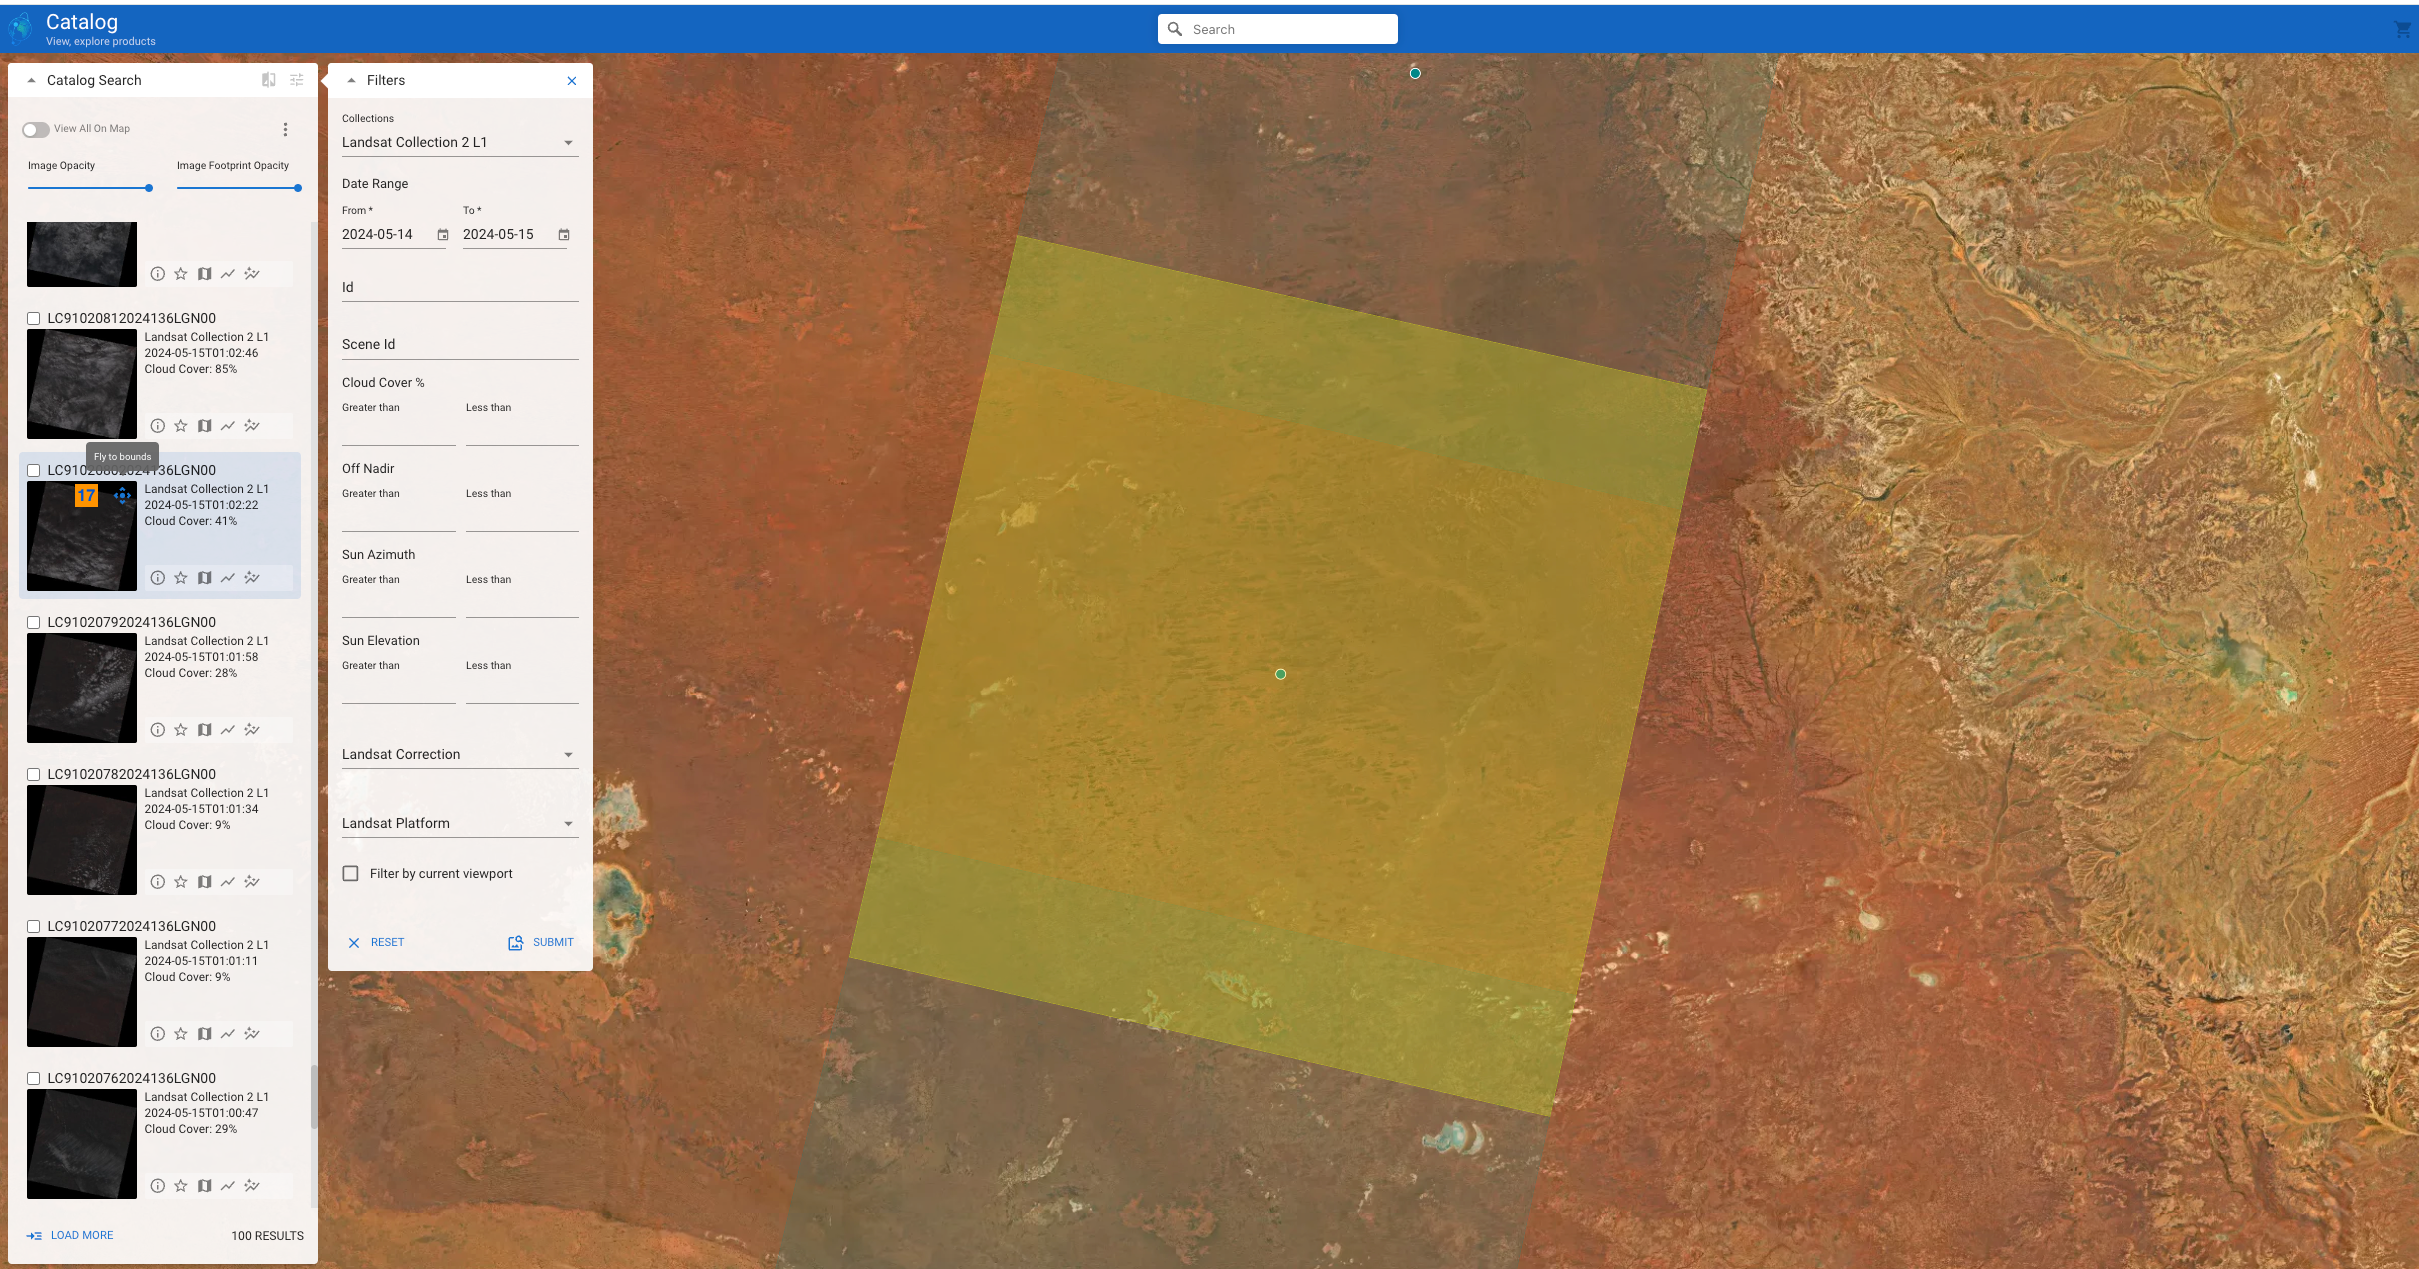
 | Fly to Bounds | Zoom in to the image location. |
 | Toggle Layer Visibility | Show/Hide the footprint on the map. |
 | View on Map | Render the image on the map. |
 | View Visualization Configuration | Toggles the visualization configuration panel where you can adjust the min and max of the available color bands and also the gamma values. You can update the min and max of the current image or optionally update all images from the same Collection. |
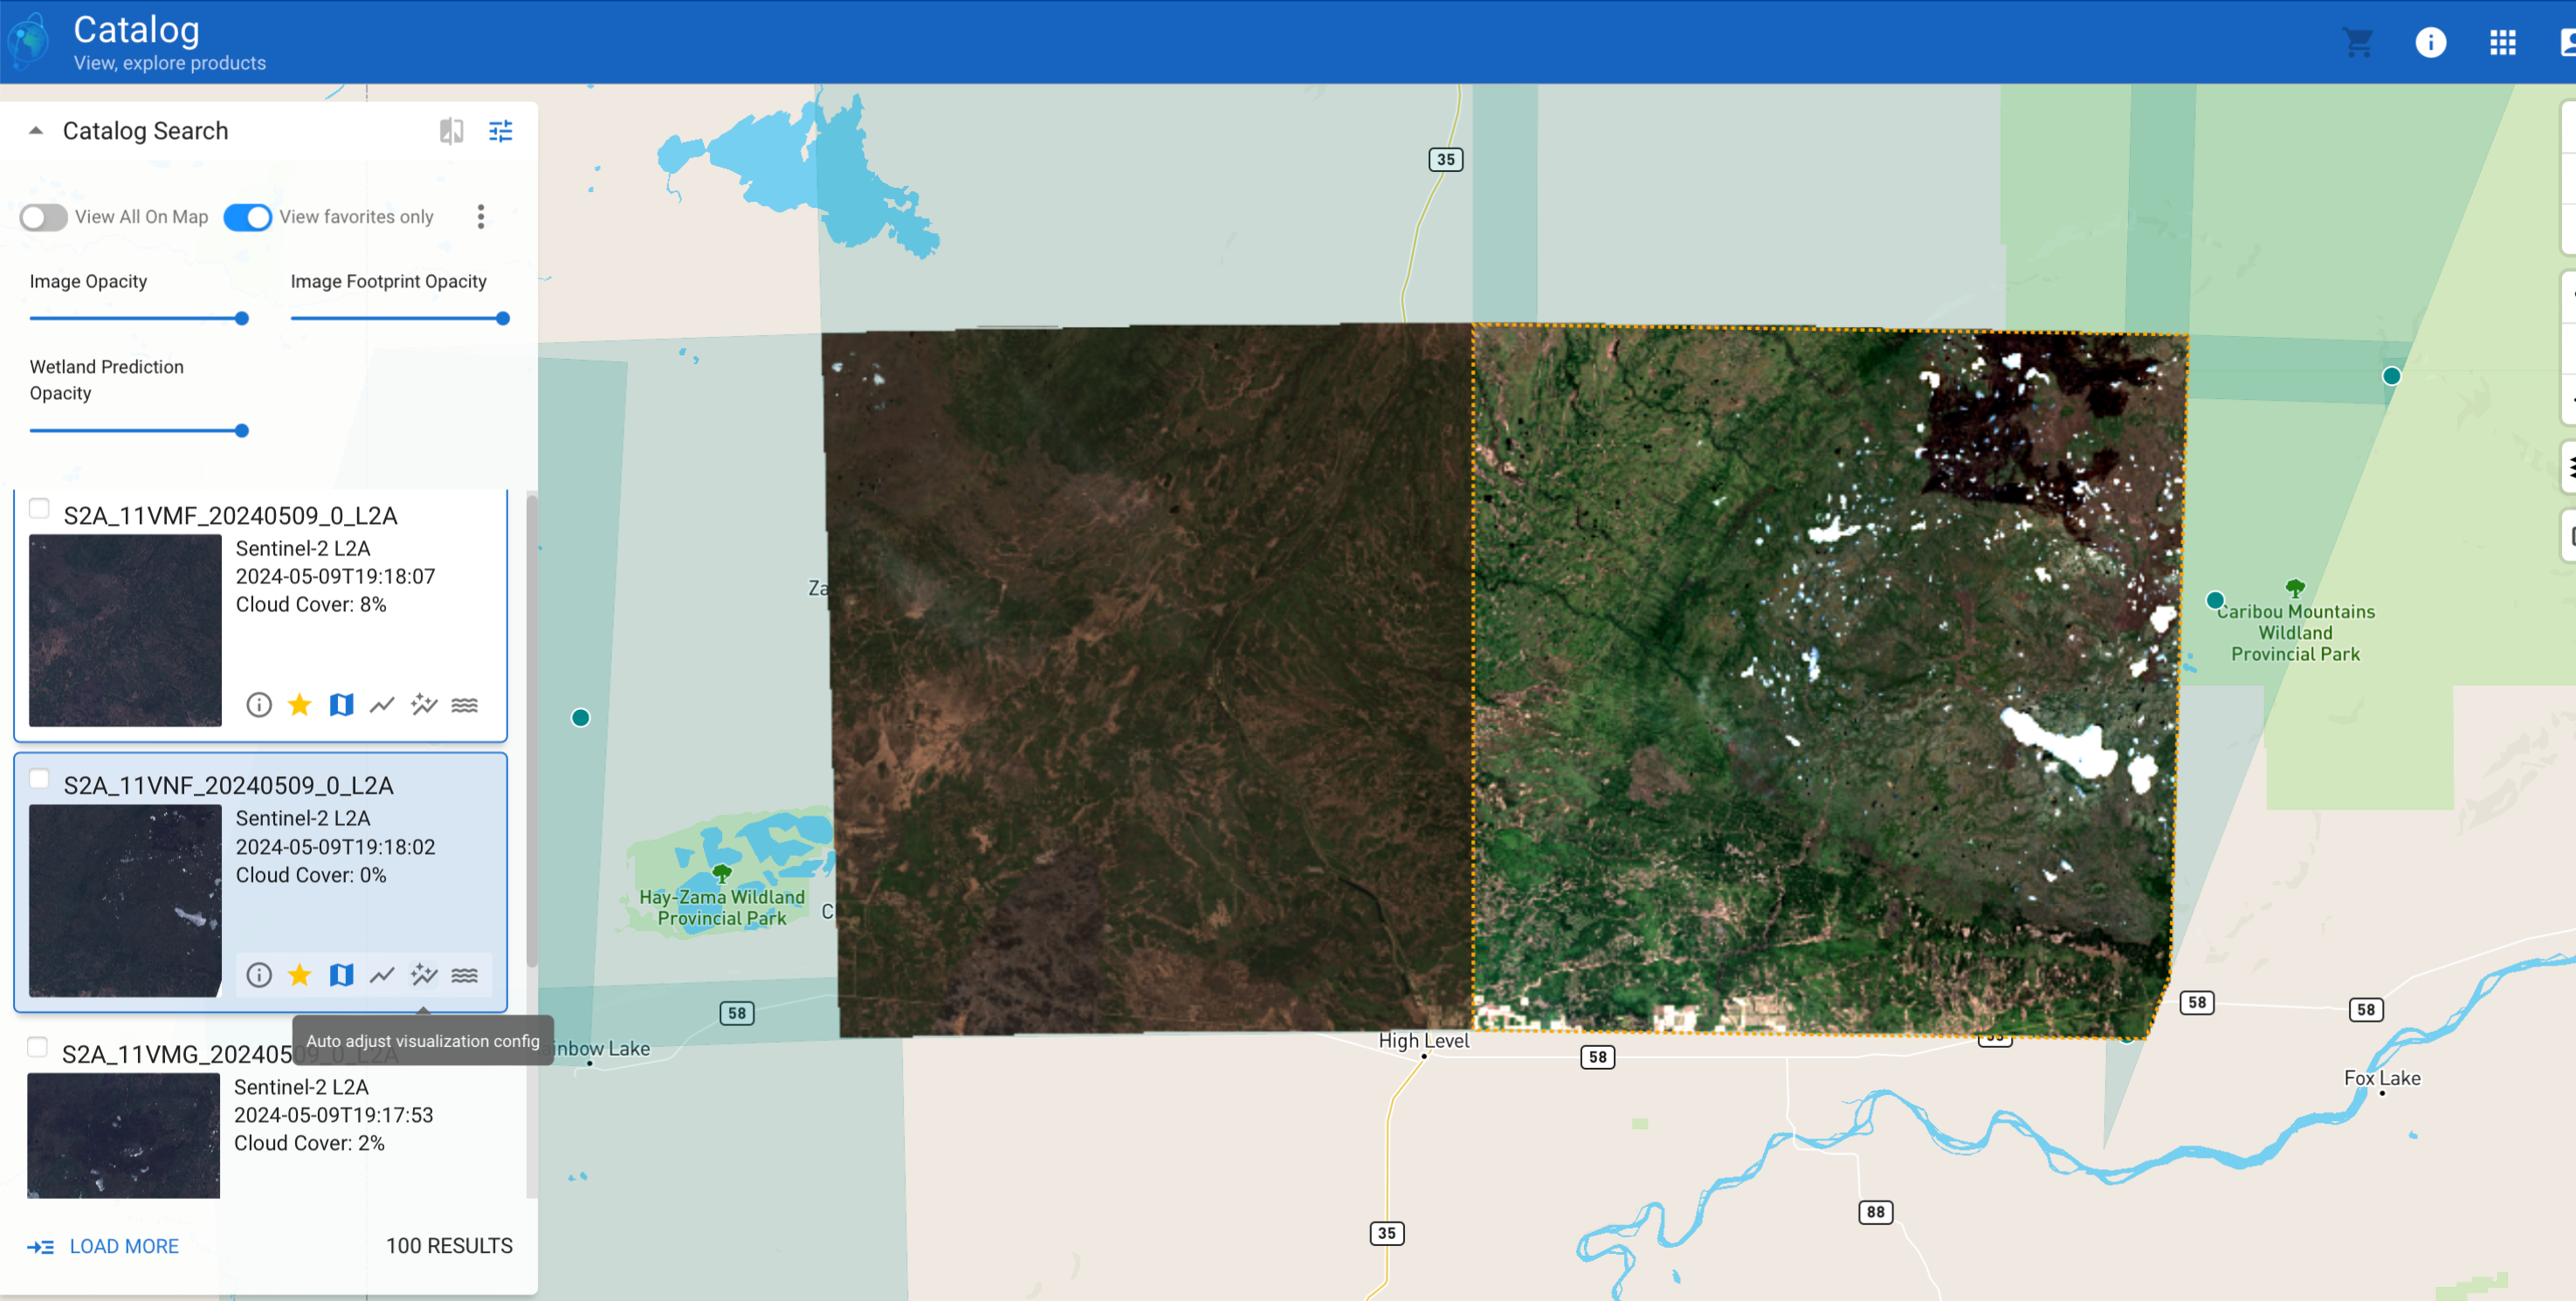
 | Auto adjust Visualization | Shorthand convenience tool to auto adjust the image by clipping desired percentages off the image, based on a calculated histogram. If the values in the visualization configuration panel have not been modified then it applies the default values of 2% and 98%. |
 | Multi-Select | Allows you to multi-select images and perform actions on them. See #25 for the action menu. |
 | Multi-Select Actions | Actions that you can perform on multiple images. The first one ‘View all on map’ allows you to render all the images on the map. Use this with caution as it takes time to render if you have a large number of images. |
 | View Favorites Only | This toggle button will show all the images that the user has tagged as favorite (see #18). |
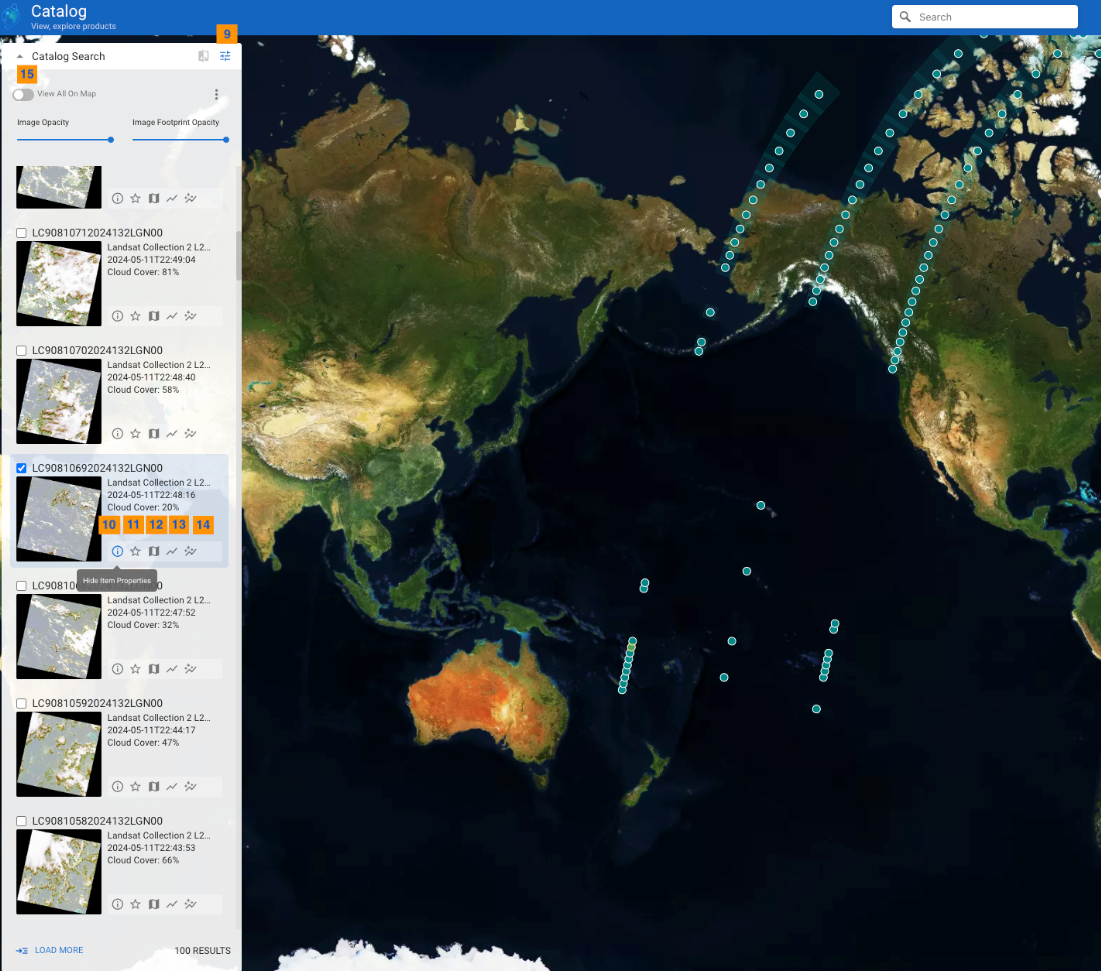
Below is an example of toggling the Item Properties to be shown on the right. A subset of the STAC item properties will be shown
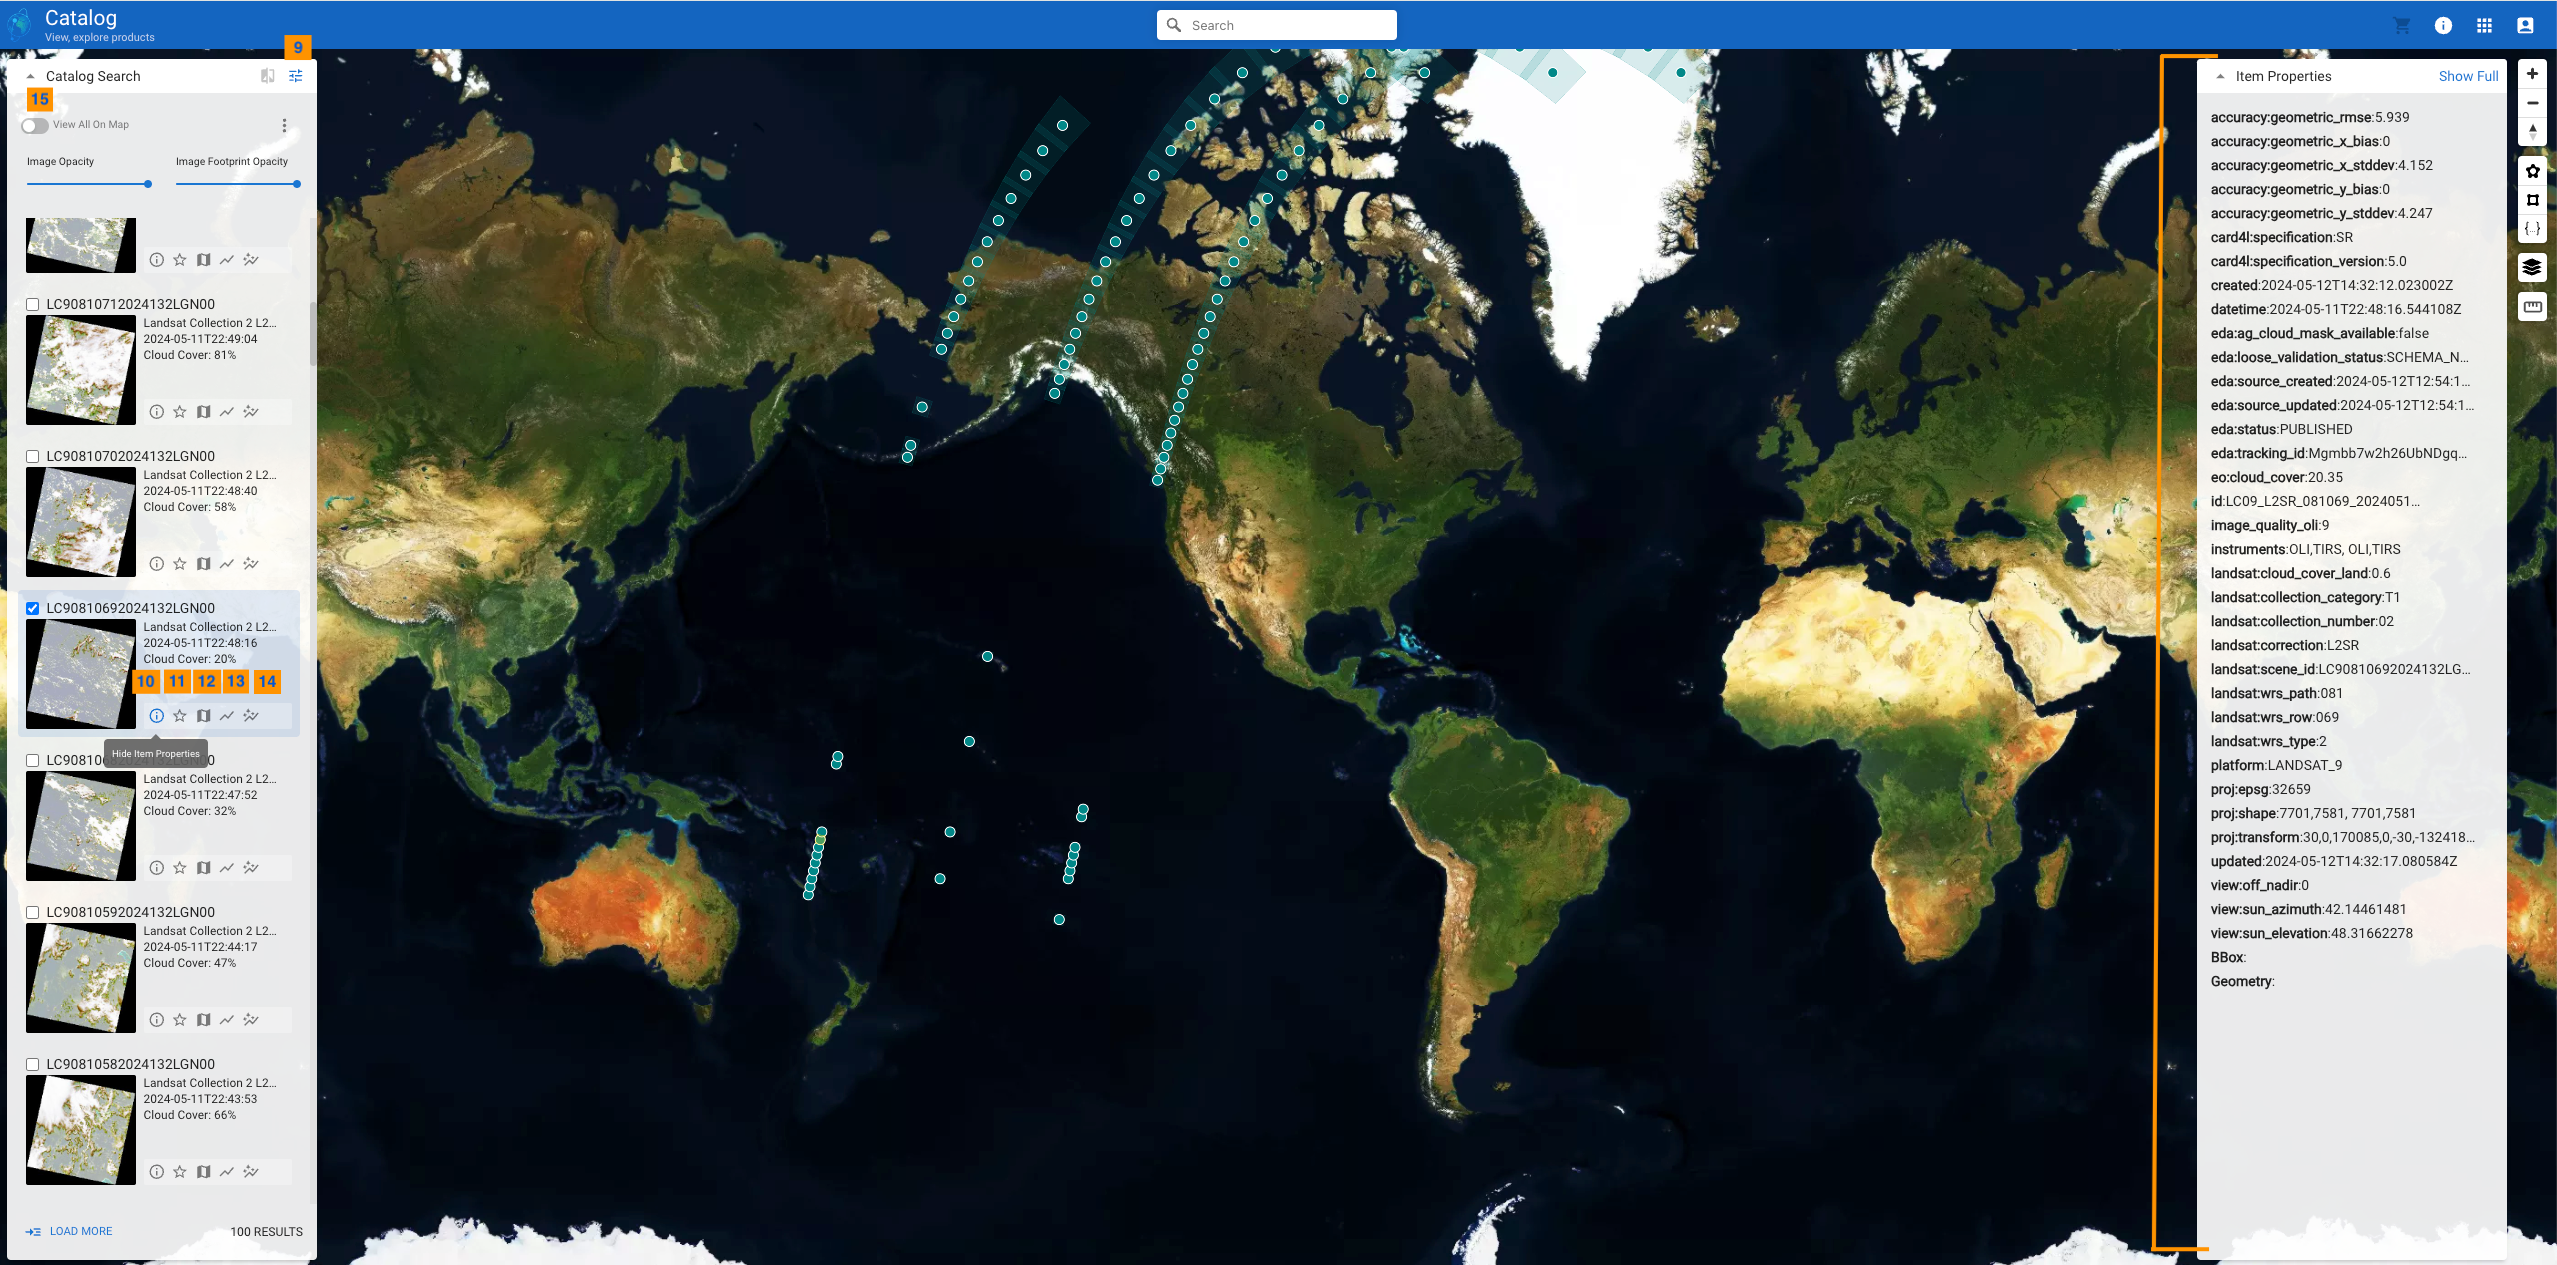
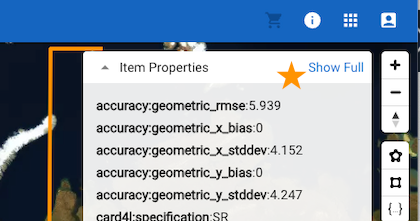
Toggle the Show Full button to show the entire contents of the STAC item properties, as below. Under the Show Full mode you can also get the individual asset urls and download the images by following the “href”
Here is an example of tagging an item as favorite and then toggling the Favorites only button to see only the favorites list
| Favorites | View Favorites |
|---|---|
 | 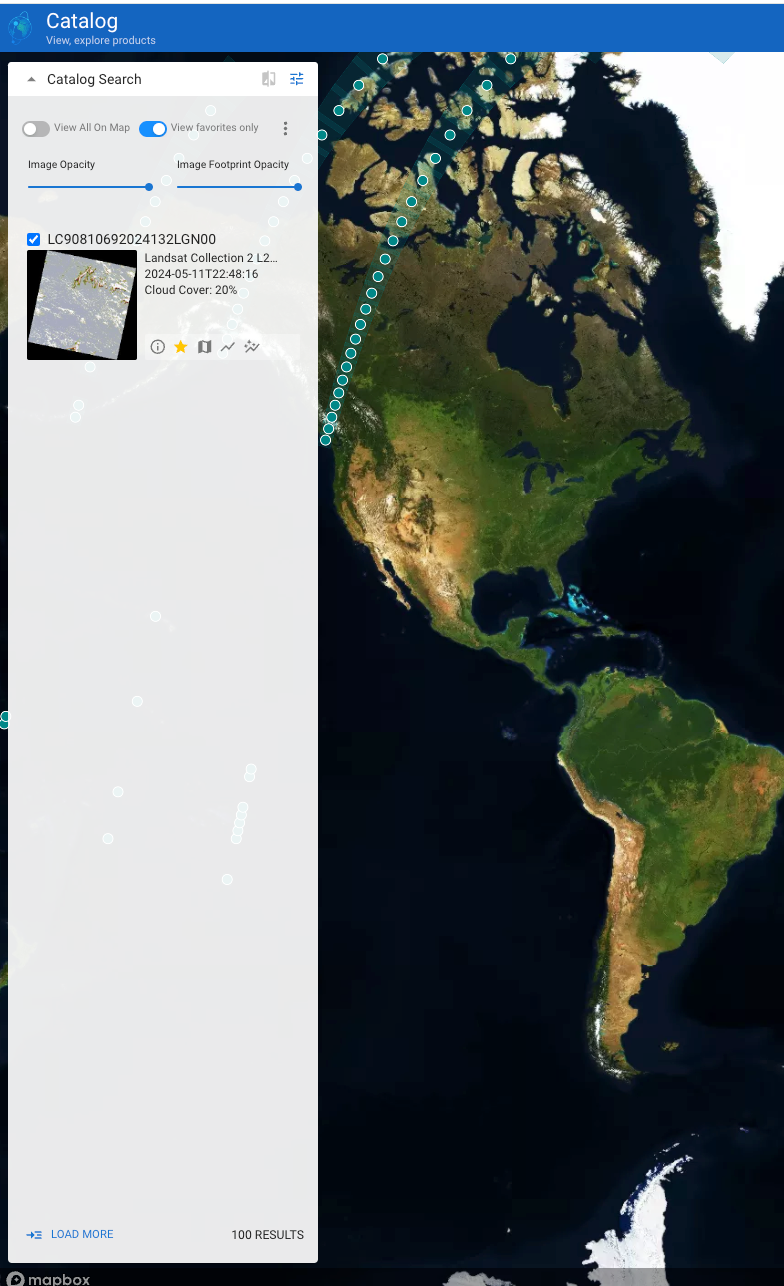 |
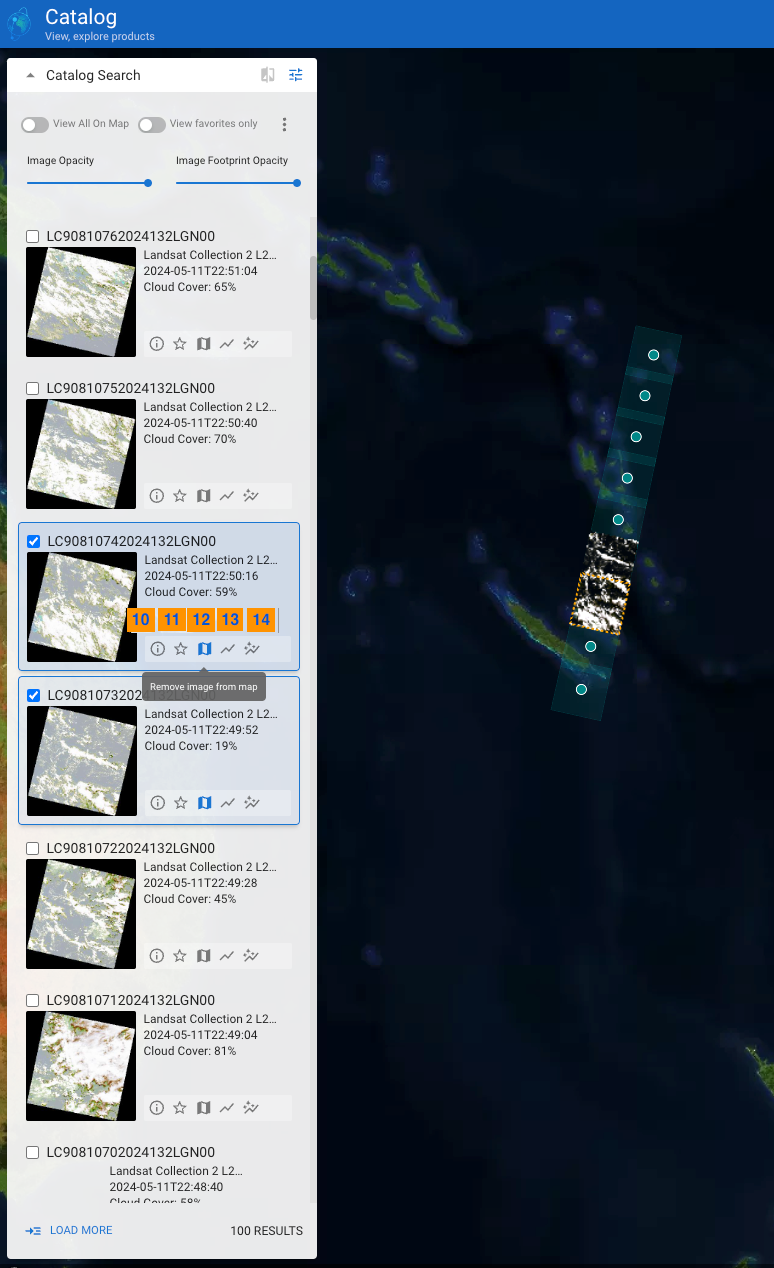
Next is an example of the View on Map button
Here is an example of what the visualization configuration options can do when you change the min and the max band ranges
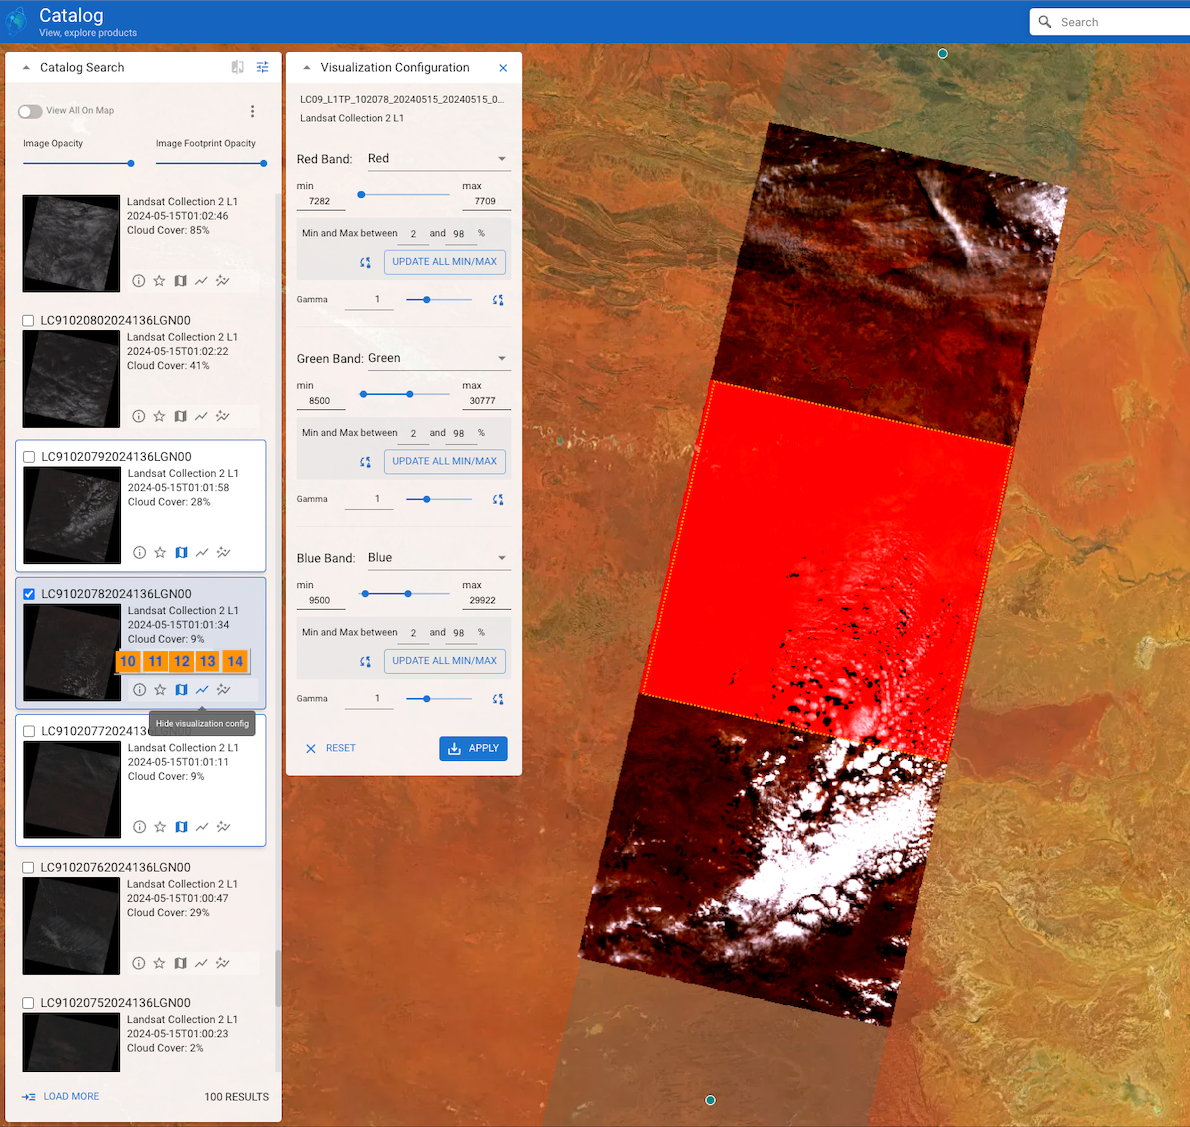
Below is an example where two images are selected and viewed on the map. Auto visualization was applied for the right hand side image and you can see the difference it makes
Below is an example of flying to the geographic bounds of an image
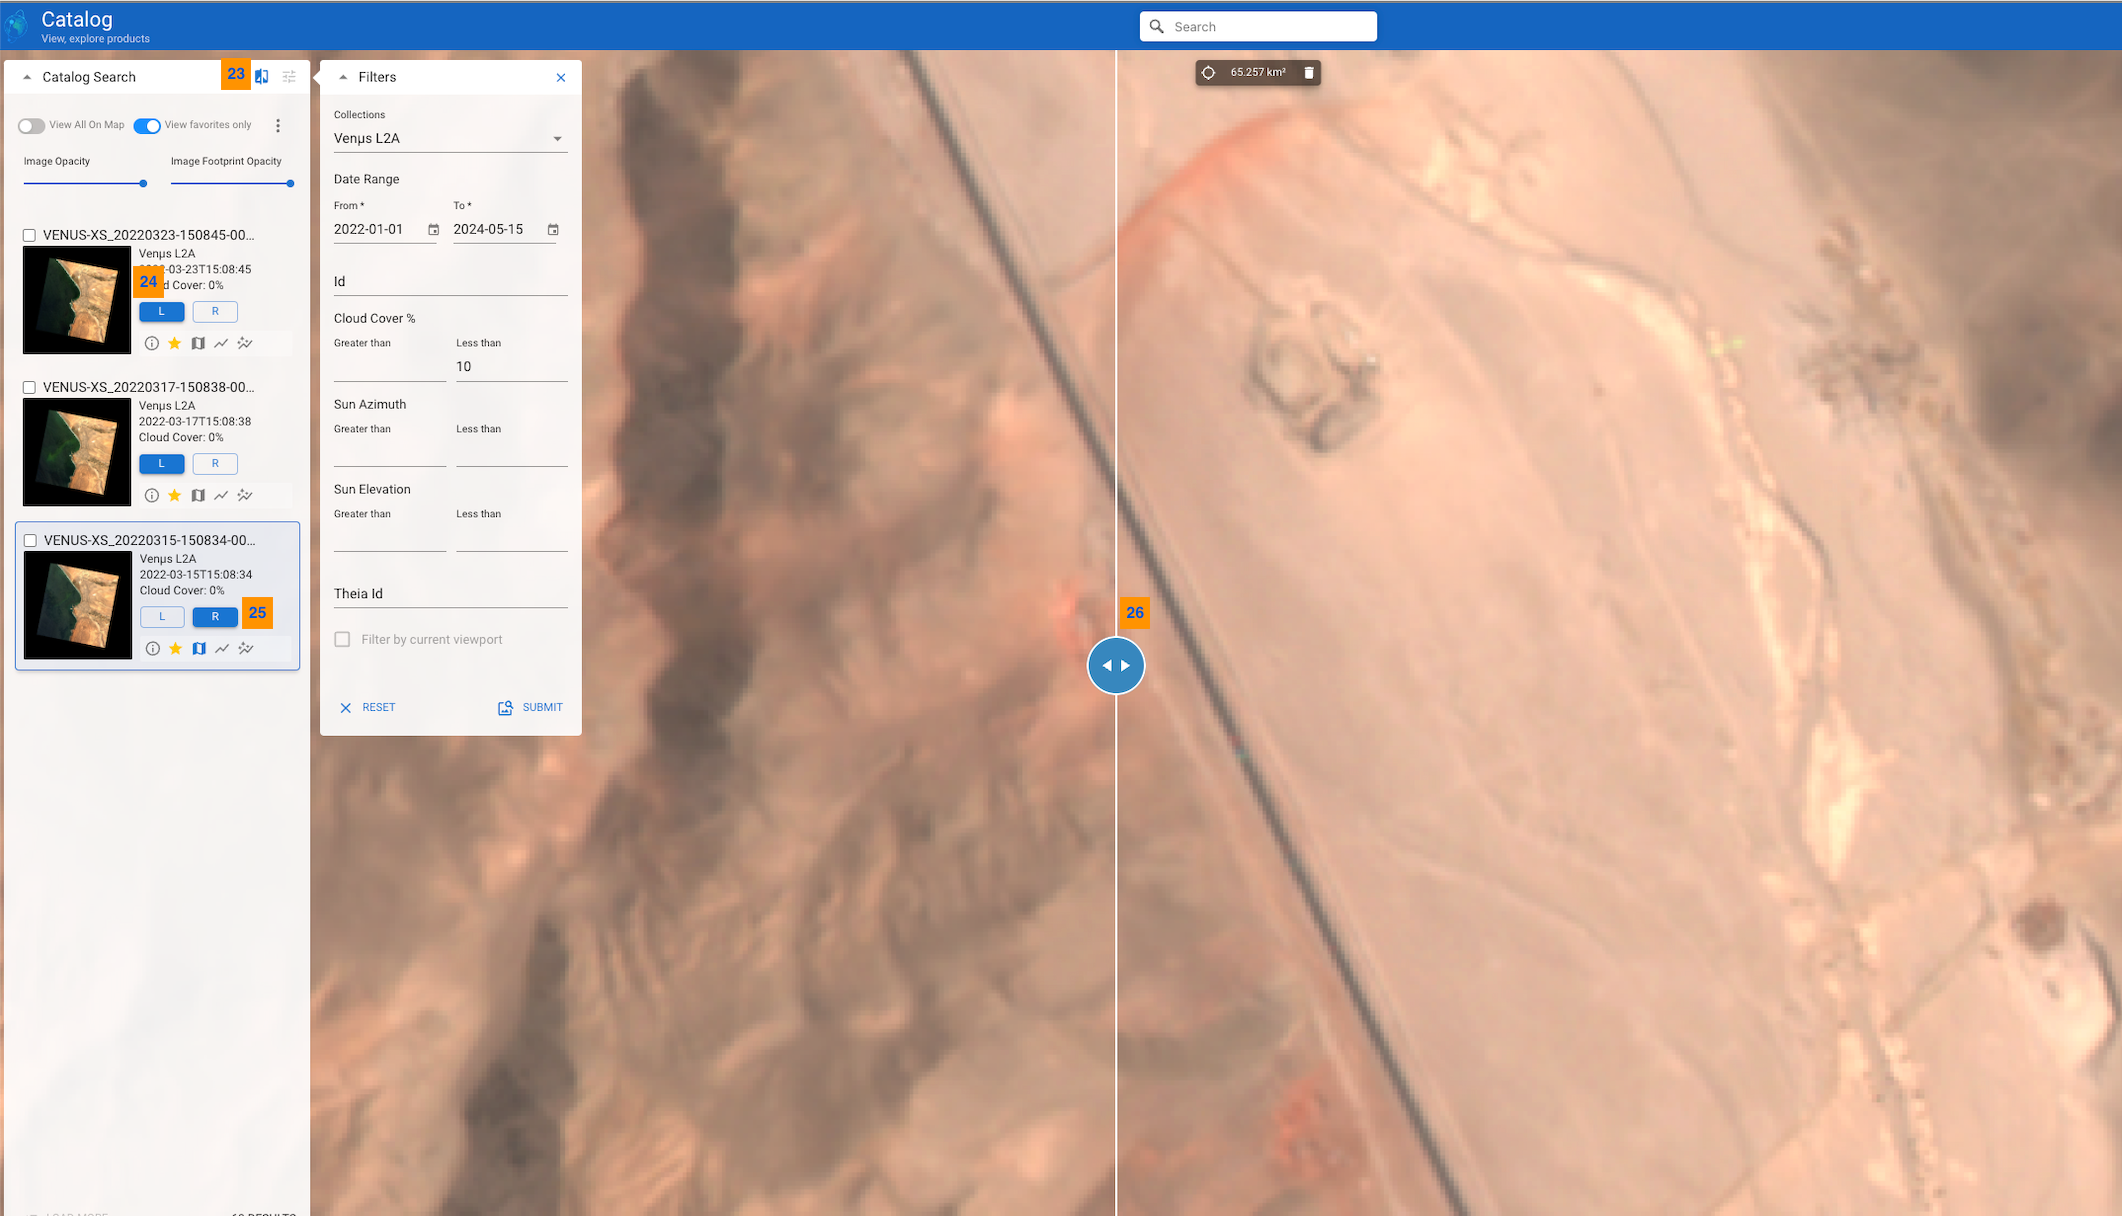
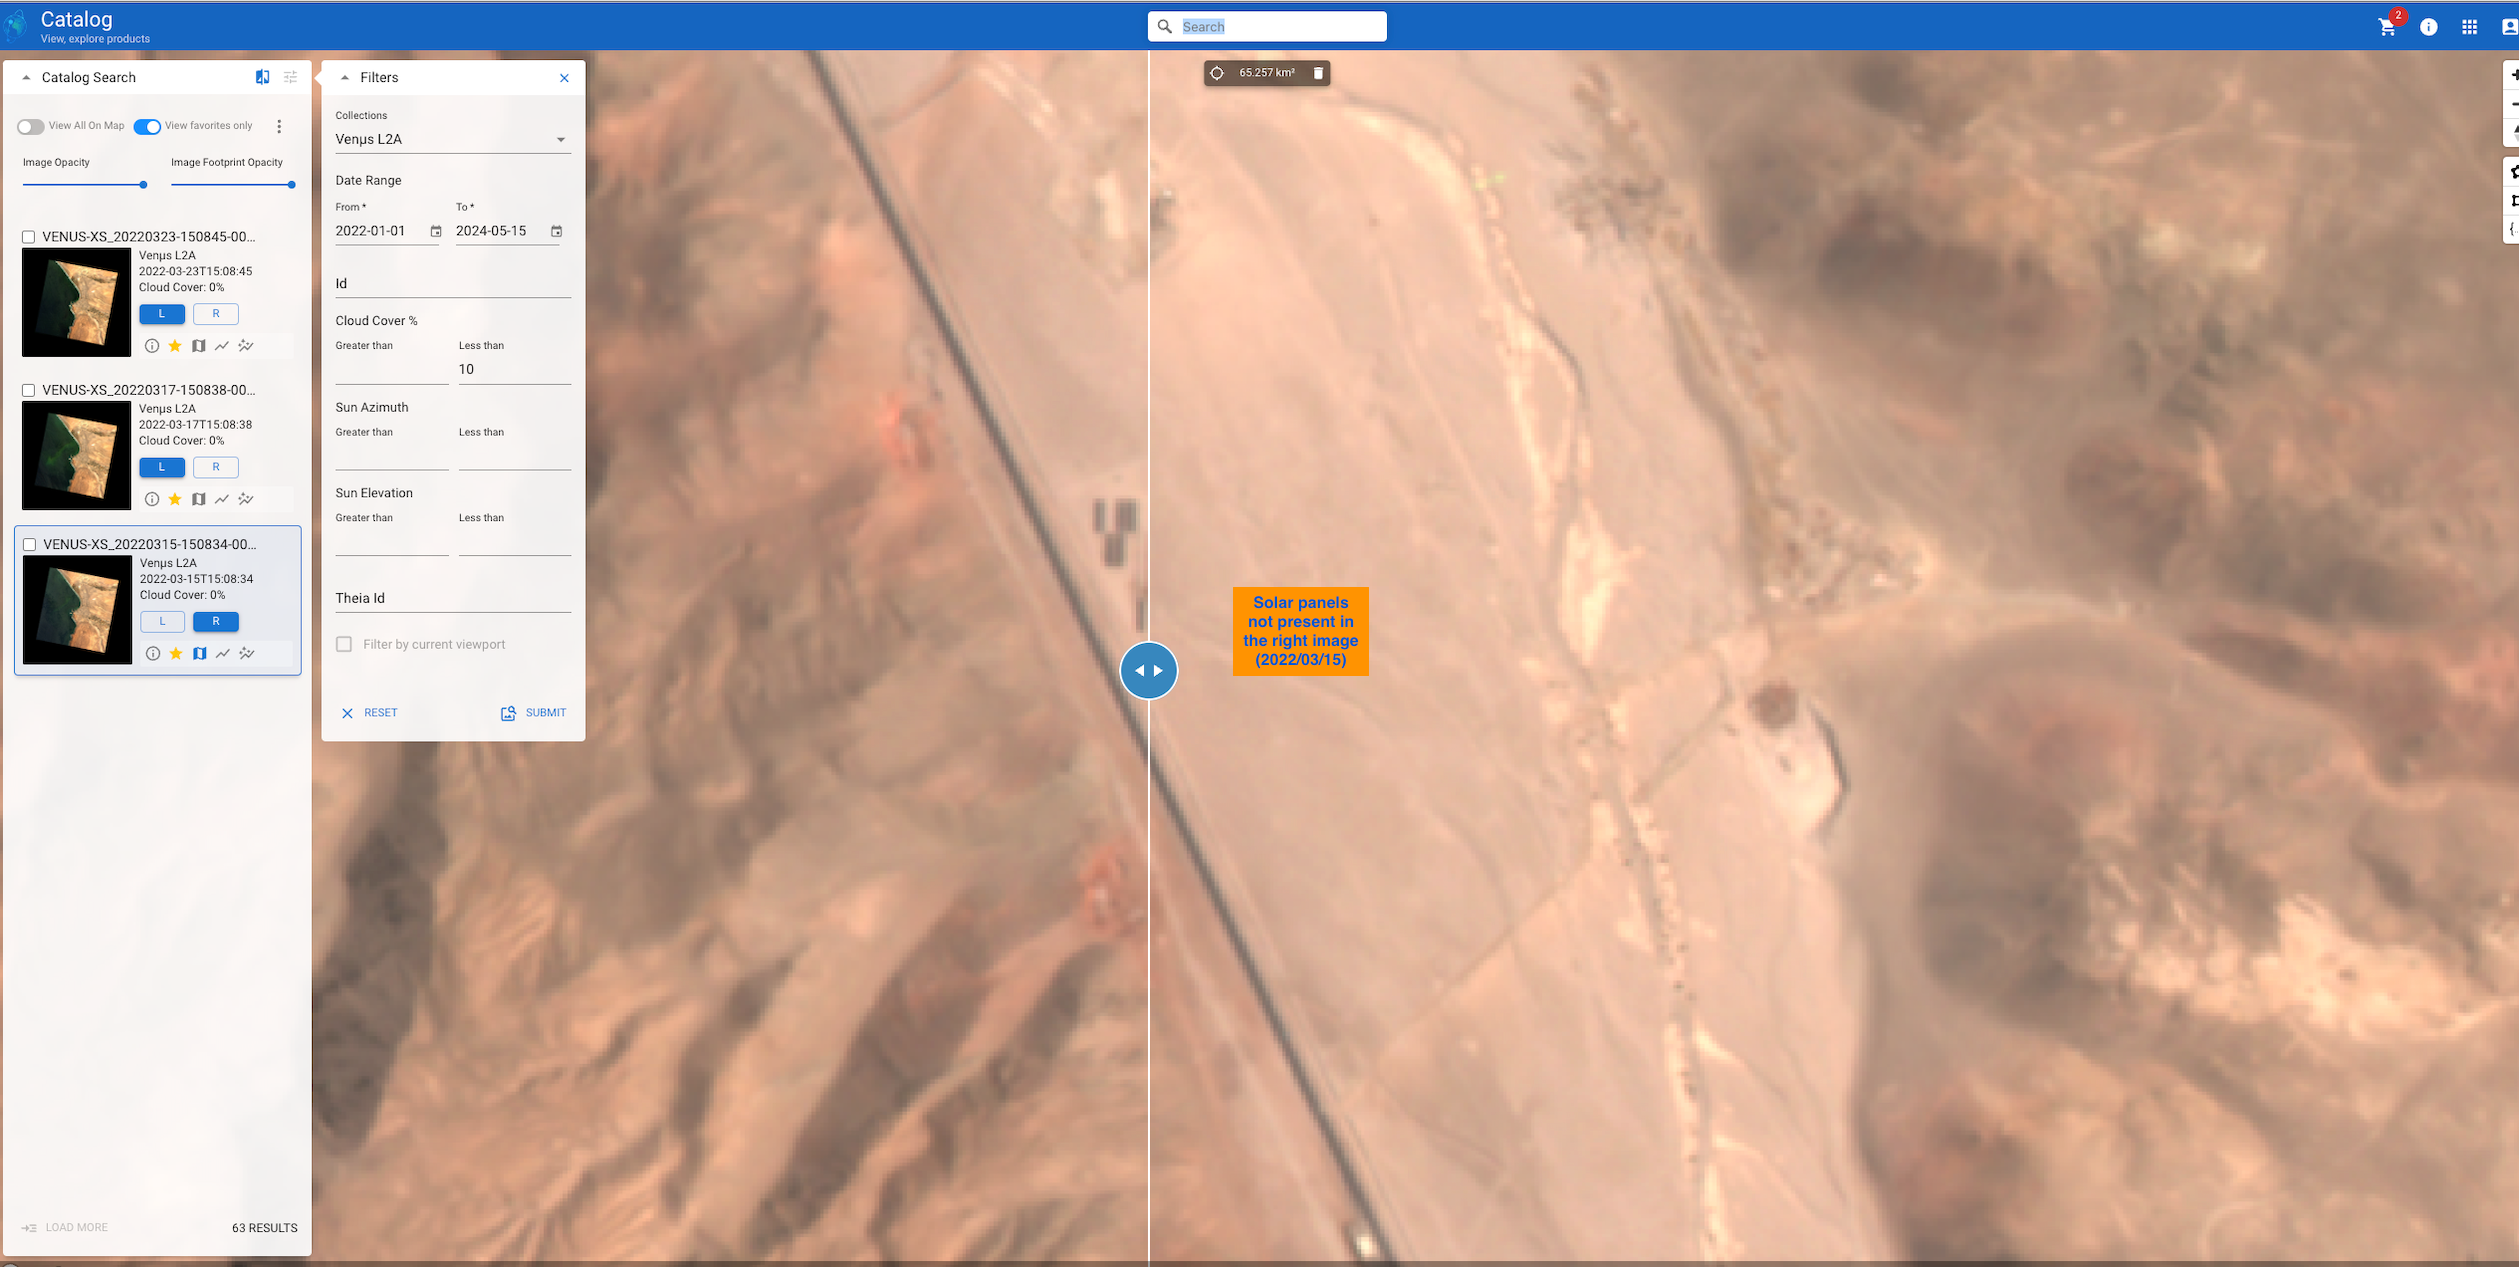
Next, we can see how we can compare two images over a period of time to see how the landscape is changing. We can do this by using the Map Slider
Below there are two images chosen over the same area but with different dates “2022-12-16“ and “2023-03-22“. They have been tagged as favorite (with view favorite list enabled) and View on Map enabled to be able to see the landscape details.
| S. No. | Label | Description |
|---|---|---|
 | Show/Hide Map Slider | This is the toggle for Map Slider. It gives you a capability to slide the area from left to right. This is especially useful when you have two images that you want to compare. As you slide you will be able to see the landscape changes given the images are of different dates. |
 | Move Image Left | Click this Left button to select the image to be seen on the left of the map slider. |
 | Move Image Right | Click this Right button to select the image to be seen on the right of the map slider. |
 | Slider | The map slider. |
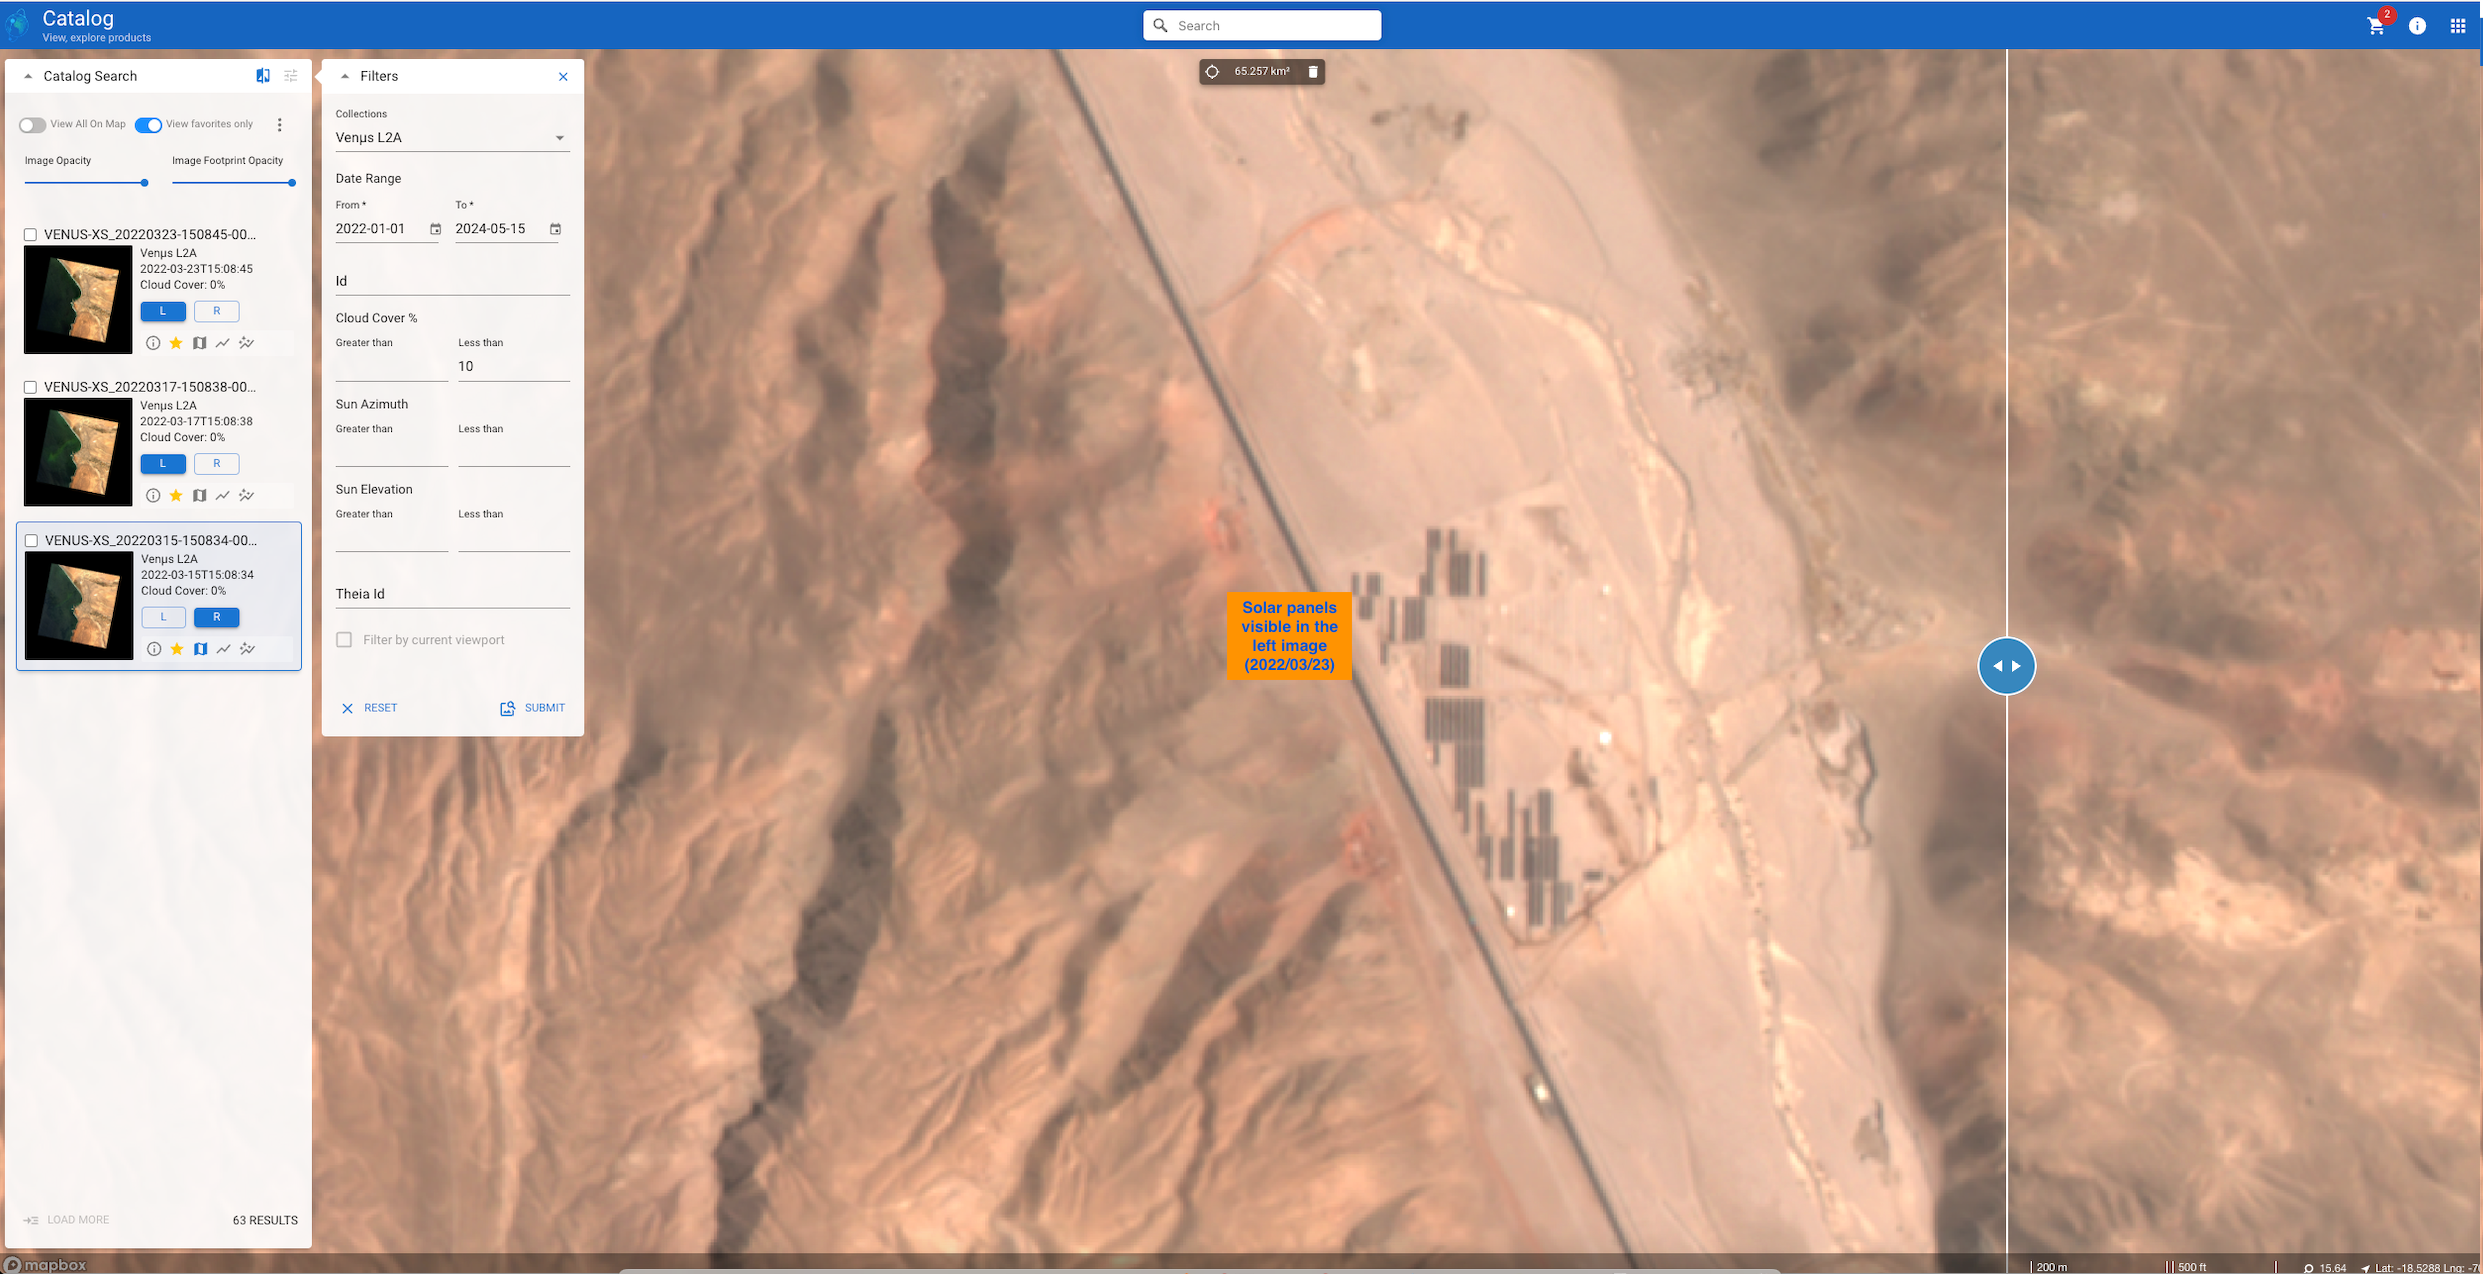
Below are the differences over another area which shows the installation of the solar panels that happened within the period 2023-10-28 to 2024-01-26
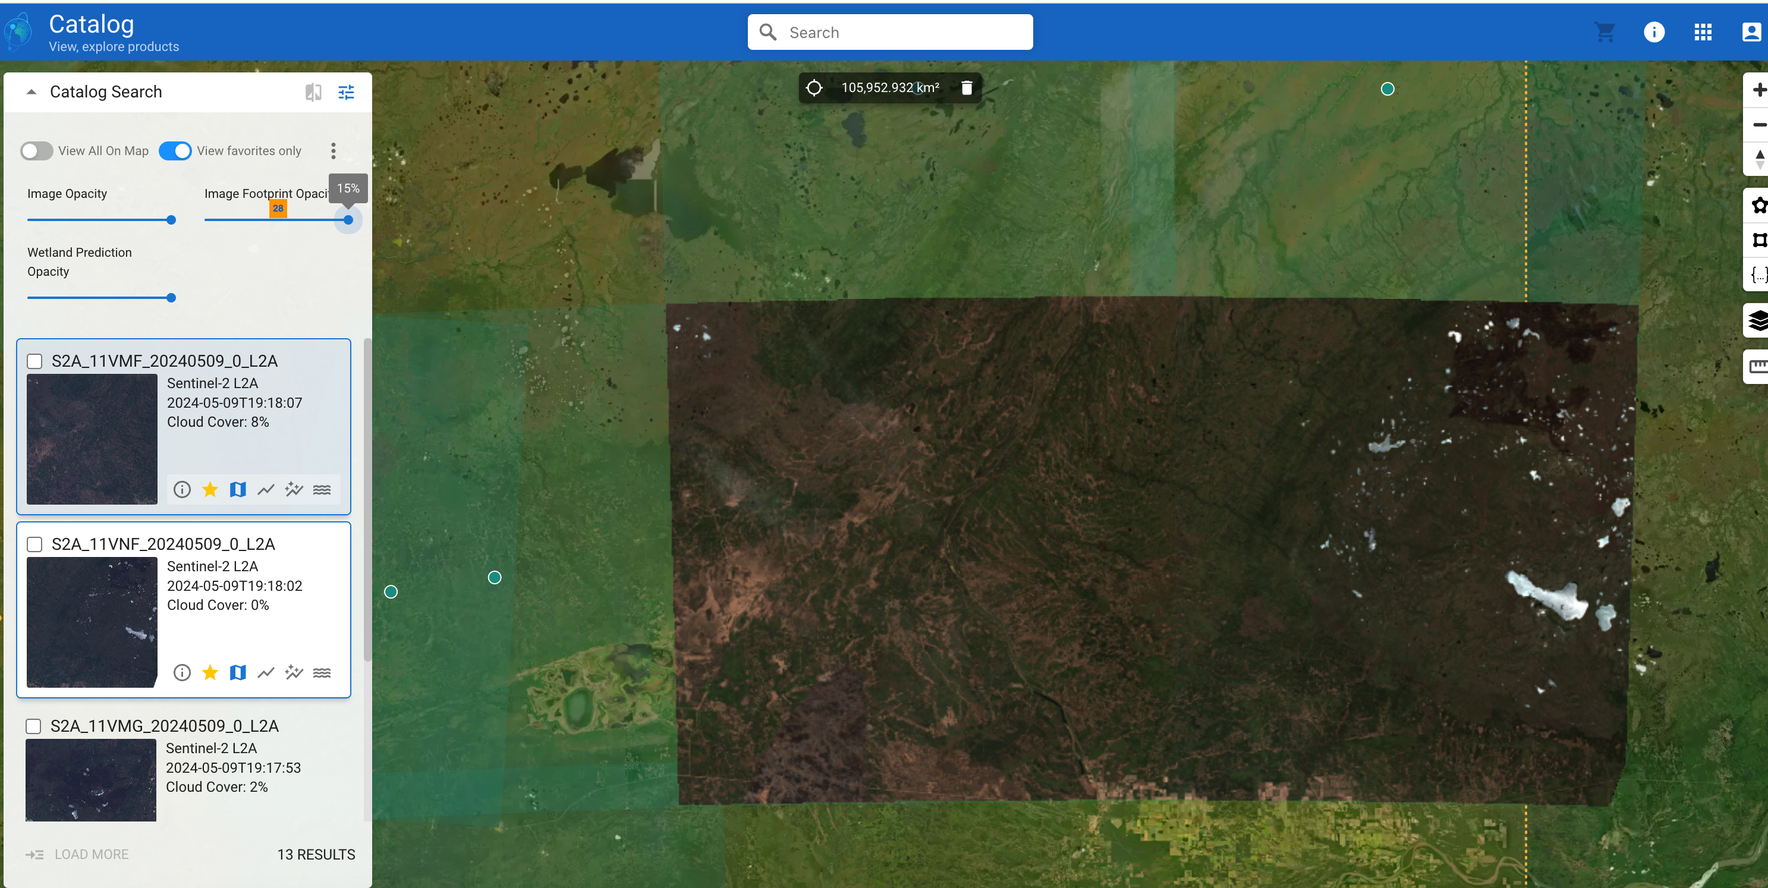
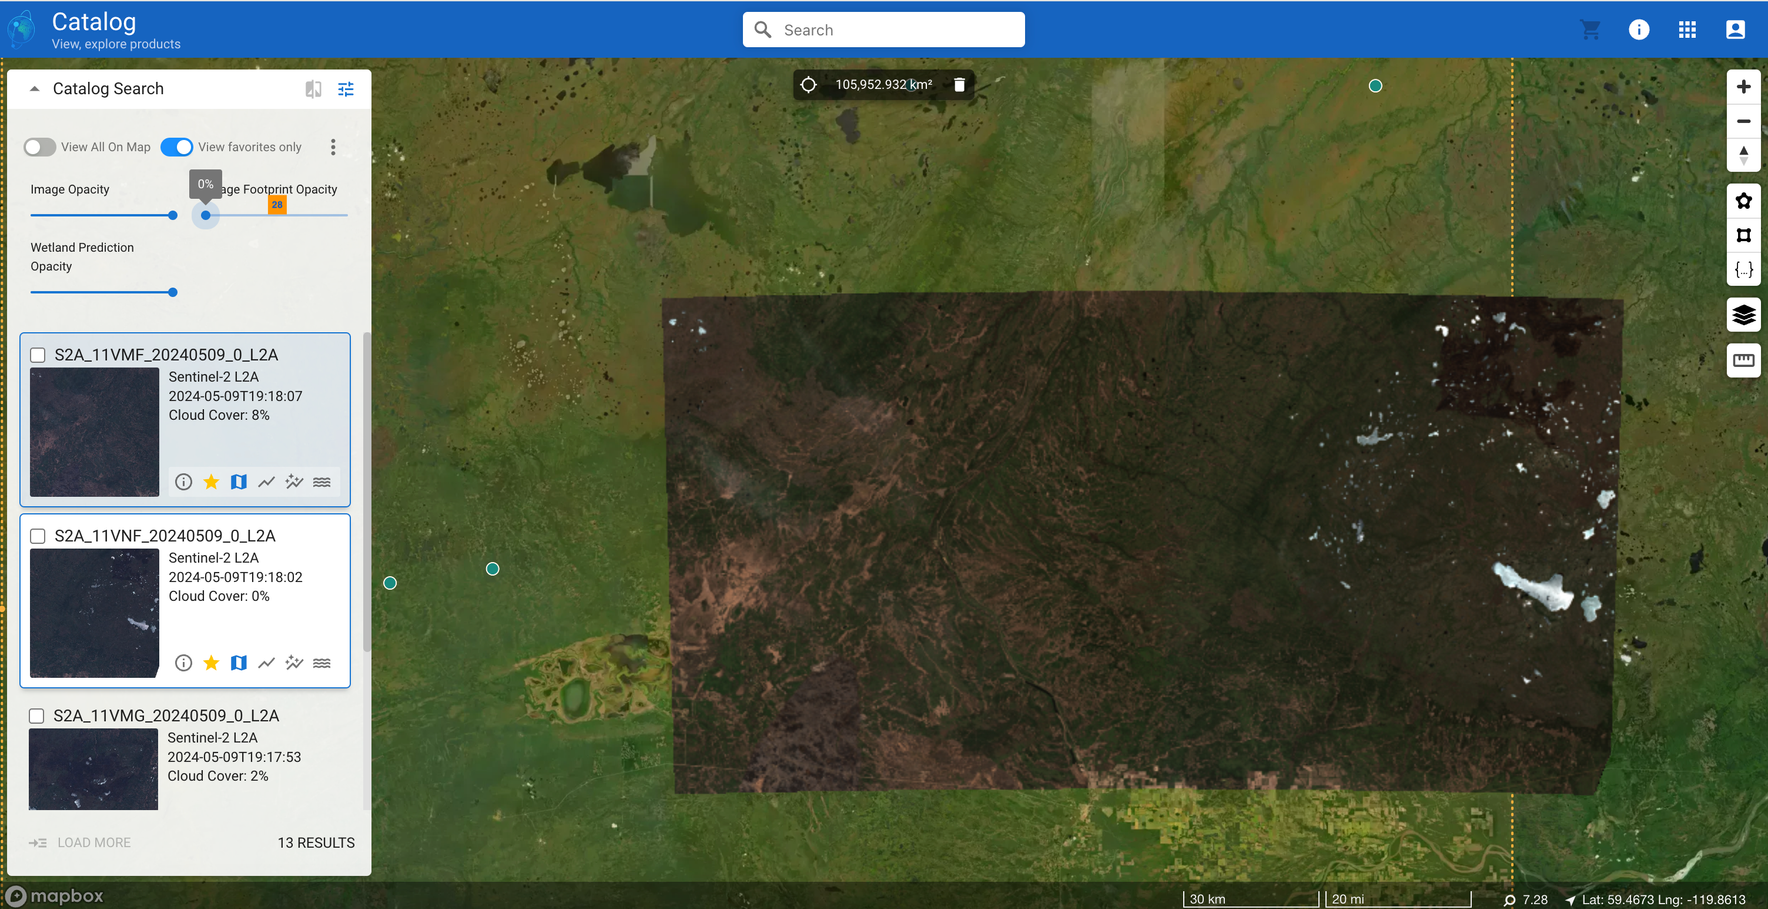
Now, there are some slider options to help you adjust the opacity
| S. No. | Label | Description |
|---|---|---|
 | Image Opacity | Image Opacity is used to toggle the opacity/transparency of an image. |
 | Image Footprint Opacity | Image Footprint Opacity is used to toggle the opactiy/transparency of the footprint of an image. This is useful when you want to see the basemap more clearly, especially when there are multiple footprints overlapping the same area causing the basemap to be difficult to see. |
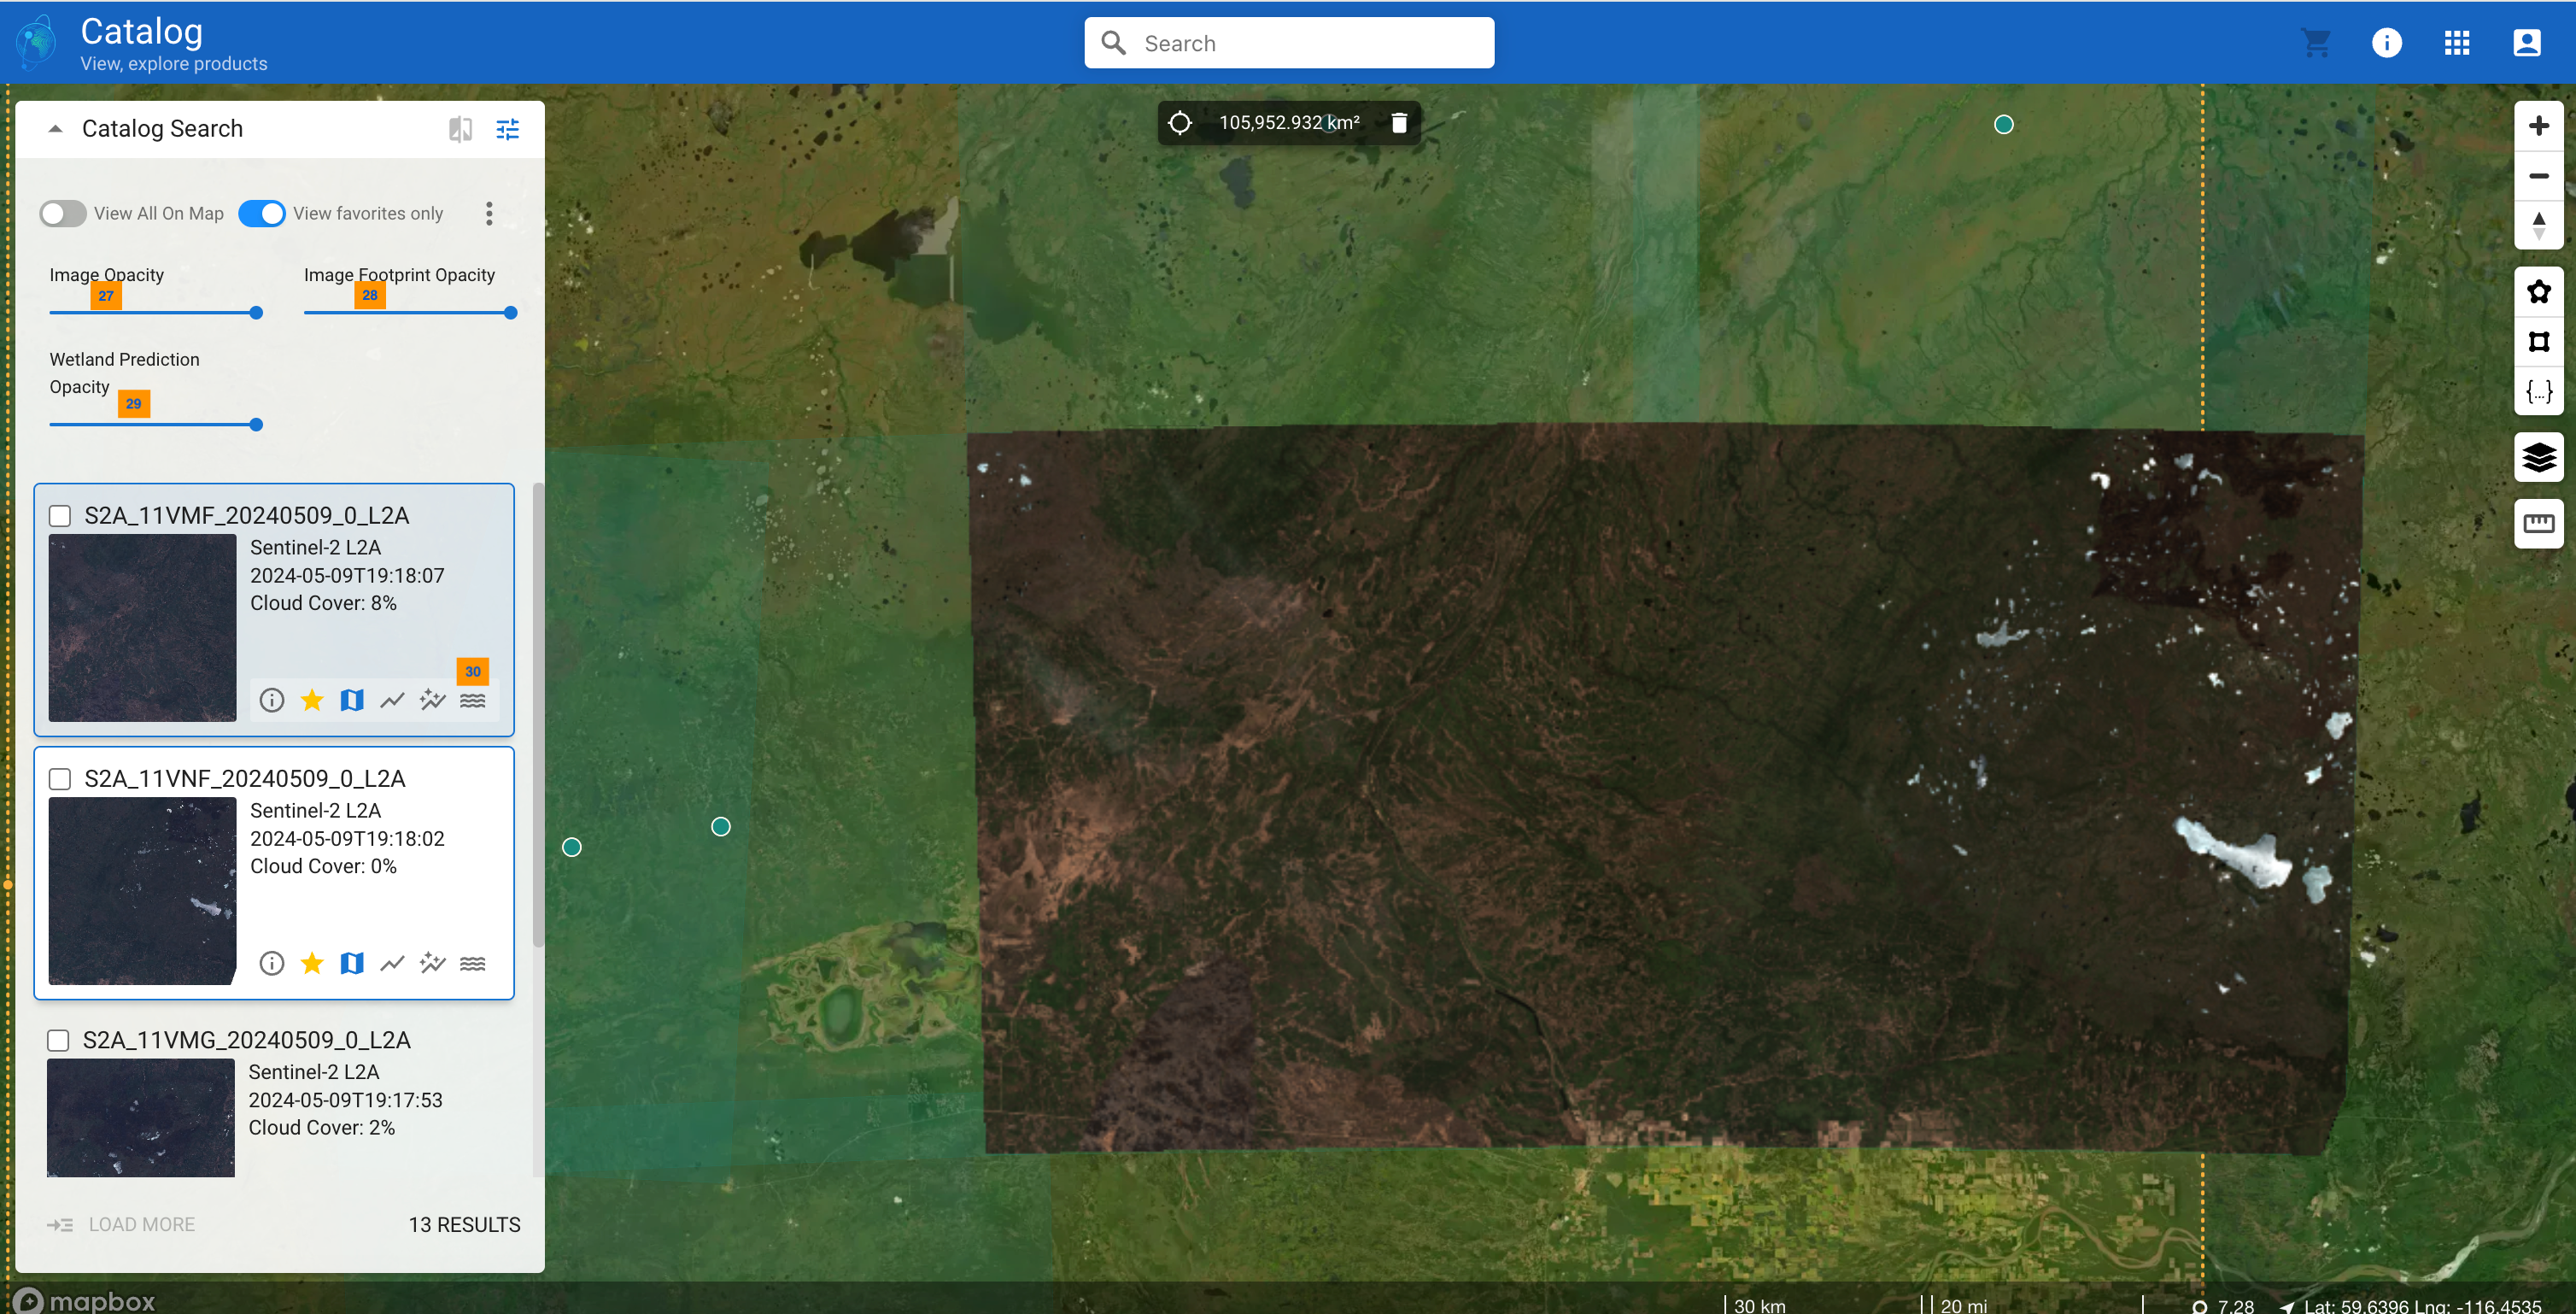
Below you can see the opacity for the image at 100%, 50% and 0
| Image Opacity 0 | Image Opacity 50 | Image Opacity 100 |
|---|---|---|
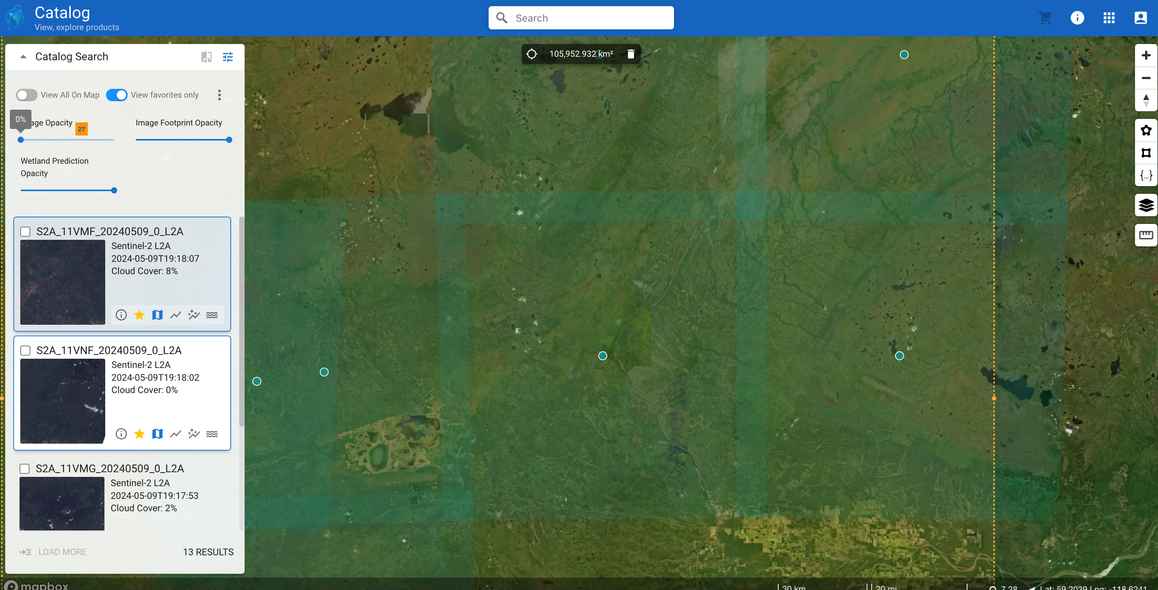 | 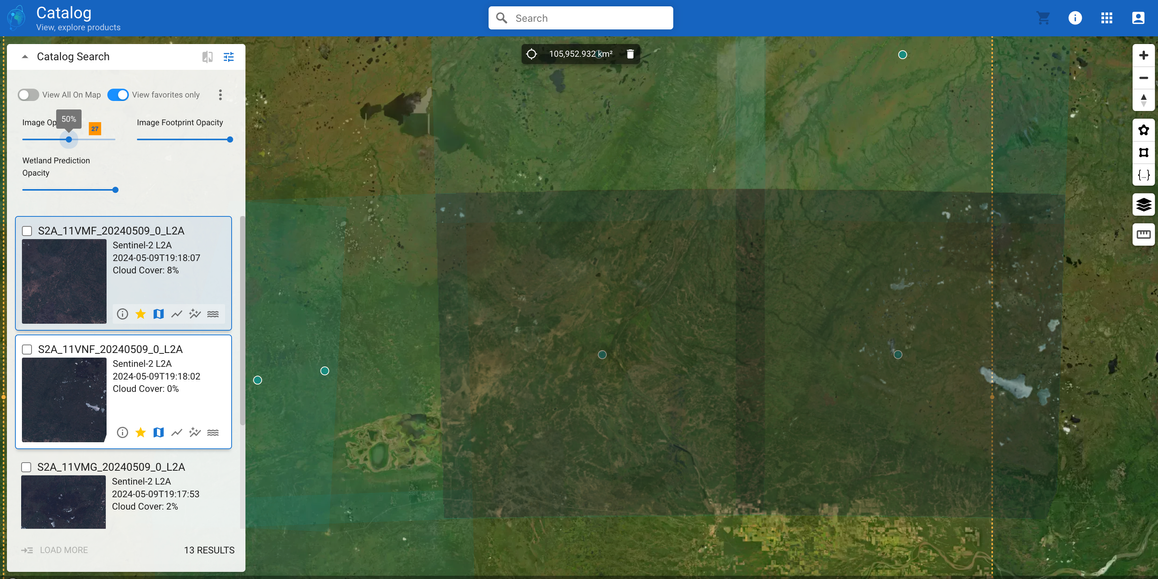 | 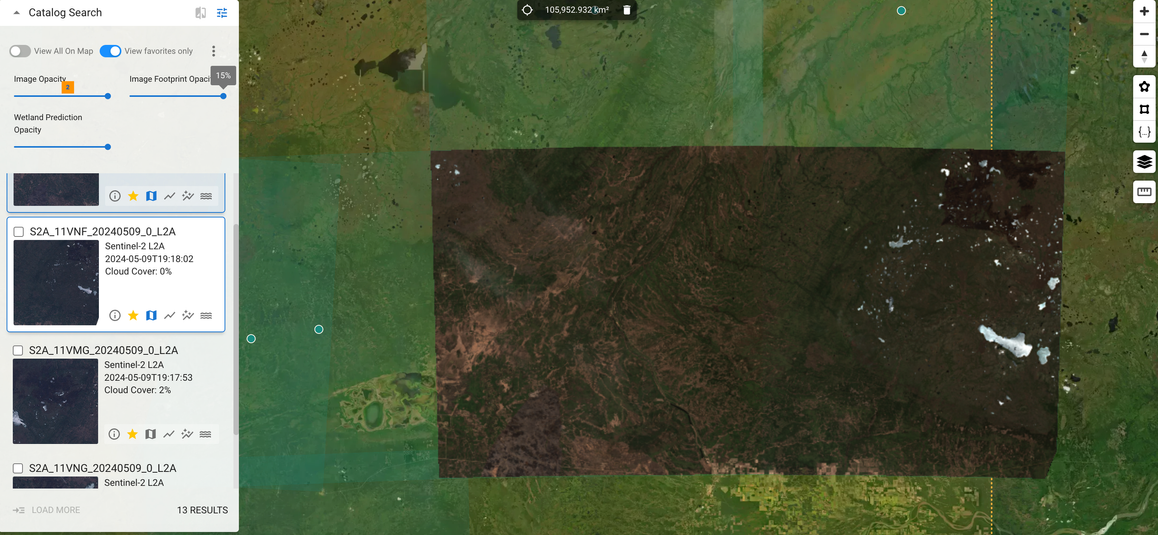 |
Here are examples of adjusting the Footprint opacity
| Footprint Opacity High | Footprint Opacity Low |
|---|---|
 |  |
That completes the list of our extensive features that are available in EarthPlatform.