Map Description🔗
NDVI Map🔗
The in-season NDVI map assess crop conditions variablity within the field. The Normalized Difference Vegetation Index (NDVI) quantifies vegetation by measuring the difference between near-infrared (which vegetation strongly reflects) and red light (which vegetation absorbs).

NDVI is the most common index that analysts use in remote sensing. NDVI is a standardized way to measure healthy vegetation. When you have high NDVI values, you have healthier vegetation. When you have low NDVI, you have less or no vegetation.
With the NDVI map API you can adjust the min and max values of the map;
EVI Map🔗
The enhanced vegetation index (EVI) was developed as an alternative vegetation index to address some of the limitations of the NDVI.

The EVI was specifically developed to: 1. be more sensitive to changes in areas having high biomass (a serious shortcoming of NDVI),2. reduce the influence of atmospheric conditions on vegetation index values, and3. correct for canopy background signals.
CVI Map🔗
The Chlorophyll vegetation index is a vegetation index correlated to plant chlorophyll activity. The CVI uses the RED/GREEN ratio to represent the relative abundance of vegetation and soil before canopy closure

This index has been identified as a high potential index to pilot the last nitrogen input on wheat for protein content, as NDVI is limited due to its saturation at high level canopies.
GNDVI Map🔗
GNDVI basically replaces the red piece of standard NDVI collection with a very specific band of light in the green range to obtain different useful information. GNDVI is more sensitive to the variation of chlorophyll content in the crop.
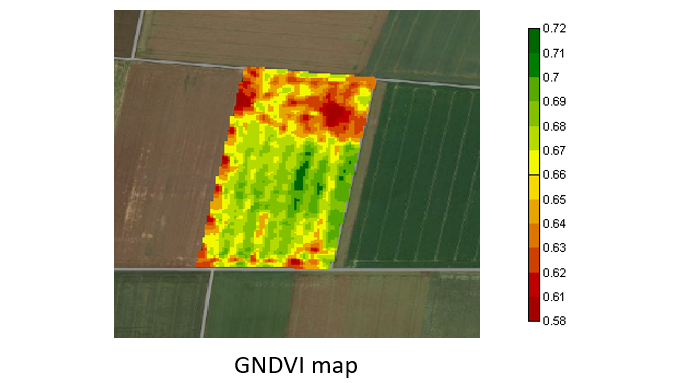
It is useful for assessing the canopy variation in biomass, and is an indicator of senescence in case of stress or late maturity stage. This index can be used to analyze crops in mid to late growth stages ,to determine water and nitrogen uptake into the crop canopy.
CVIN Map🔗
The in-season Chlorophyll Vegetation Normalized indexed map is a vegetation index correlated to plant chlorophyll activity. It is used for late-cycle nitrogen management advice on cereals that aim to improve the protein content of the crop.

S2REP Map🔗
The in-season Sentinel2 Red-Egde Position indexed map is used to estimate the rate of nitrogen uptake by cereals.

With the rate of nitrogen uptake and the biomass of the crop (estimated using LAI), the user can calculates the nitrogen nutrition index (NNI) and the nitrogen requirement of the crop at T time.
NDWI Map🔗
The NDWI is used to monitor changes related to water content in water bodies. As water bodies strongly absorb light in visible to infrared electromagnetic spectrum, NDWI uses green and near infrared bands to highlight water bodies. It is sensitive to built-up land and can result in over-estimation of water bodies. The index was proposed by McFeeters, 1996.
Values description: Index values greater than 0.5 usually correspond to water bodies. Vegetation usually corresponds to much smaller values and built-up areas to values between zero and 0.2.
Note: NDWI index is often used synonymously with the NDMI index, often using NIR-SWIR combination as one of the two options. NDMI seems to be consistently described using NIR-SWIR combination. As the indices with these two combinations work very differently, with NIR-SWIR highlighting differences in water content of leaves, and GREEN-NIR highlighting differences in water content of water bodies, we have decided to separate the indices on our repository as NDMI using NIR-SWIR, and NDWI using GREEN-NIR.

Yield Goal Map🔗
The Yield Goal Map is used to define the yield goal distribution inside the field, based on the field variability. User defines the yield he wants to target for the coming season. The legend is dynamic (going from red to blue), this means the minimum and maximum of the legend is adapted for each field.

This information is used by the grower during the establishment of the inputs plan prior to the season: he can push areas with high potential and decrease areas with low potential. The YGM is used to create variable rates application maps. Based on the yield potential variability of the field, the user can modulate the inputs application on the field.
The user has access to past images of vegetation peak period and will choose an archive map with same crop. The user can choose between different weather context to build a scenario and define his yield goal map.
Yield Variability Map🔗
The Yield Variability Map shows the yield variability of the field based on an historic average yield. The legend is dynamic (going from red to blue), this means the minimum and maximum of the legend is adapted for each field.

This information is used by the grower during the establishment of the inputs plan prior to the season: he can push areas with high potential and decrease areas with low potential. The YVM is used to create variable rates application maps. Based on the yield potential variability of the field, the user can modulate the inputs application on the field.
The user has access to past images of vegetation peak period and will choose an archive map with same crop. The user can choose between different weather context to build a scenario and define his yield map.
Organic Matter Map🔗
The Organic Matter Variability Map is used to represent the relative organic matter distribution in the field (i.e. the nitrogen available within the soil).
The legend is dynamic (going from red to blue), this means the minimum and maximum of the legend is adapted for each field.

This information is used by the grower during the establishment of the fertilization strategy, to plan and modulate the nitrogen fertilization.
The Organic Matter Variability Map, combined with a Yield Variability or Yield Goal Map, is used to create variable rate nitrogen application map. The yield goal map allows setting the nitrogen needs in each area of the field. By taking into account the nitrogen needs to reach the yield goal and the nitrogen already available in the soil, the user can modulate the nitrogen fertilization to be applied in the field.
SAMZ Map🔗
The SAMZ API allows to automatically create a 5 zones SAMZ map based on the most relevant archive imagery of vegetation images:
- The 2 last context
- The 2 last wet context images
- The last one bare soil image

SAMZ analyzes the crops’ vegetation behavior from satellite imagery archives representing multiple years of variable weather patterns and delineates areas with a different behavior.
The SAMZ map represents the permanent variability of the field, derived from multiple crop seasons. It shows a spatial representation of the limiting factors of soil through the analysis of the crop-weather-soil interaction.
The SAMZ map is comparable to the classification of several years of yield maps.
The SAMZ maps uses are numerous because they depend on the production limiting factors of the field:
- The baseline inputs modulation (P, K, CaO...) and the seeds modulation are the first uses as they directly related to the "quality" of the soil.
- The nitrogen variable fertilization plan also allows to take into account the variability of the nitrogen restitution of soil before the crop season and in-season due to better sampling of leaf analyzes to assess the index of nitrgoen nutrition of plants and thus to adjust the provided application dose.
The SAMZ map is sent with the following statistics values on the zones: - Productivity index for the map and by zone. It corresponds to the average, for each zone, of NDVI calculated on all vegetation images*100. - Field variability level (low, medium, or high) for the map and by zone - The most variable class: the class that has the higher NDVI values variability. - The two classes with the highest inter-class variability: for each class, the Euclidean distance from each of the other class is calculated; then the two farthest classes are identified.
Prescription (Rx) Map🔗
Prescription maps are generated from a range of geo-referenced data, such as our products, and provide defined homogenous zones of a field. The user can then define the rate he wants to apply for each zone. Then, by using the field position from a GPS receiver and the delivered prescription map, the farmer can apply the right concentration of an input (eg fertiliser or seeds) in the right place as he moves through the field.
Model Map🔗
Model maps (in season generic and field average models) allow the user to get nitrogen auto-generated preconisation maps. Those maps are available for NDVI, CVI and LAI, and for a specific list of crops (given as parameter):
- WINTER_DURUM_WHEAT
- WINTER_SOFT_WHEAT
- SPRING_DURUM_WHEAT
- SOFT_WHITE_SPRING_WHEAT
- WINTER_BARLEY
- SPRING_BARLEY
- TRITICALE
- WINTER_OSR
Soil Map🔗
The soil map provides soil data and information produced by the National Cooperative Soil Survey.
Sample Map🔗
The sample map allows the user to generate a full map from samples. Indeed, when information is reduced to a few surveys, cartography is the means to extrapolate and extend knowledge beyond the known.
Elevation and Slope Map🔗
the elevation map provide additional element to analyse the fields. Elevations are usually measured in meters or feet with reference to the sea level. It can be either above the sea level or below the sea level. Elevation in a map is shown using contour lines, bands of same colours or by numerical values giving the exact elevation details. The slope map is a topographic map showing changes in elevation on a highly detailed level.

Difference Map🔗
The user can easily create a difference map from two different product. These maps are mainly used to highlight changes within a plot (during a disaster, for example, to detect the impacted area, or after sowing to detect the planted area).