Home
💼 Home🔗
The Home Page consists of a combination of Widgets displayed in one or many views. Each Widget is configurable in its size, shape and location.
1. Available Widgets🔗
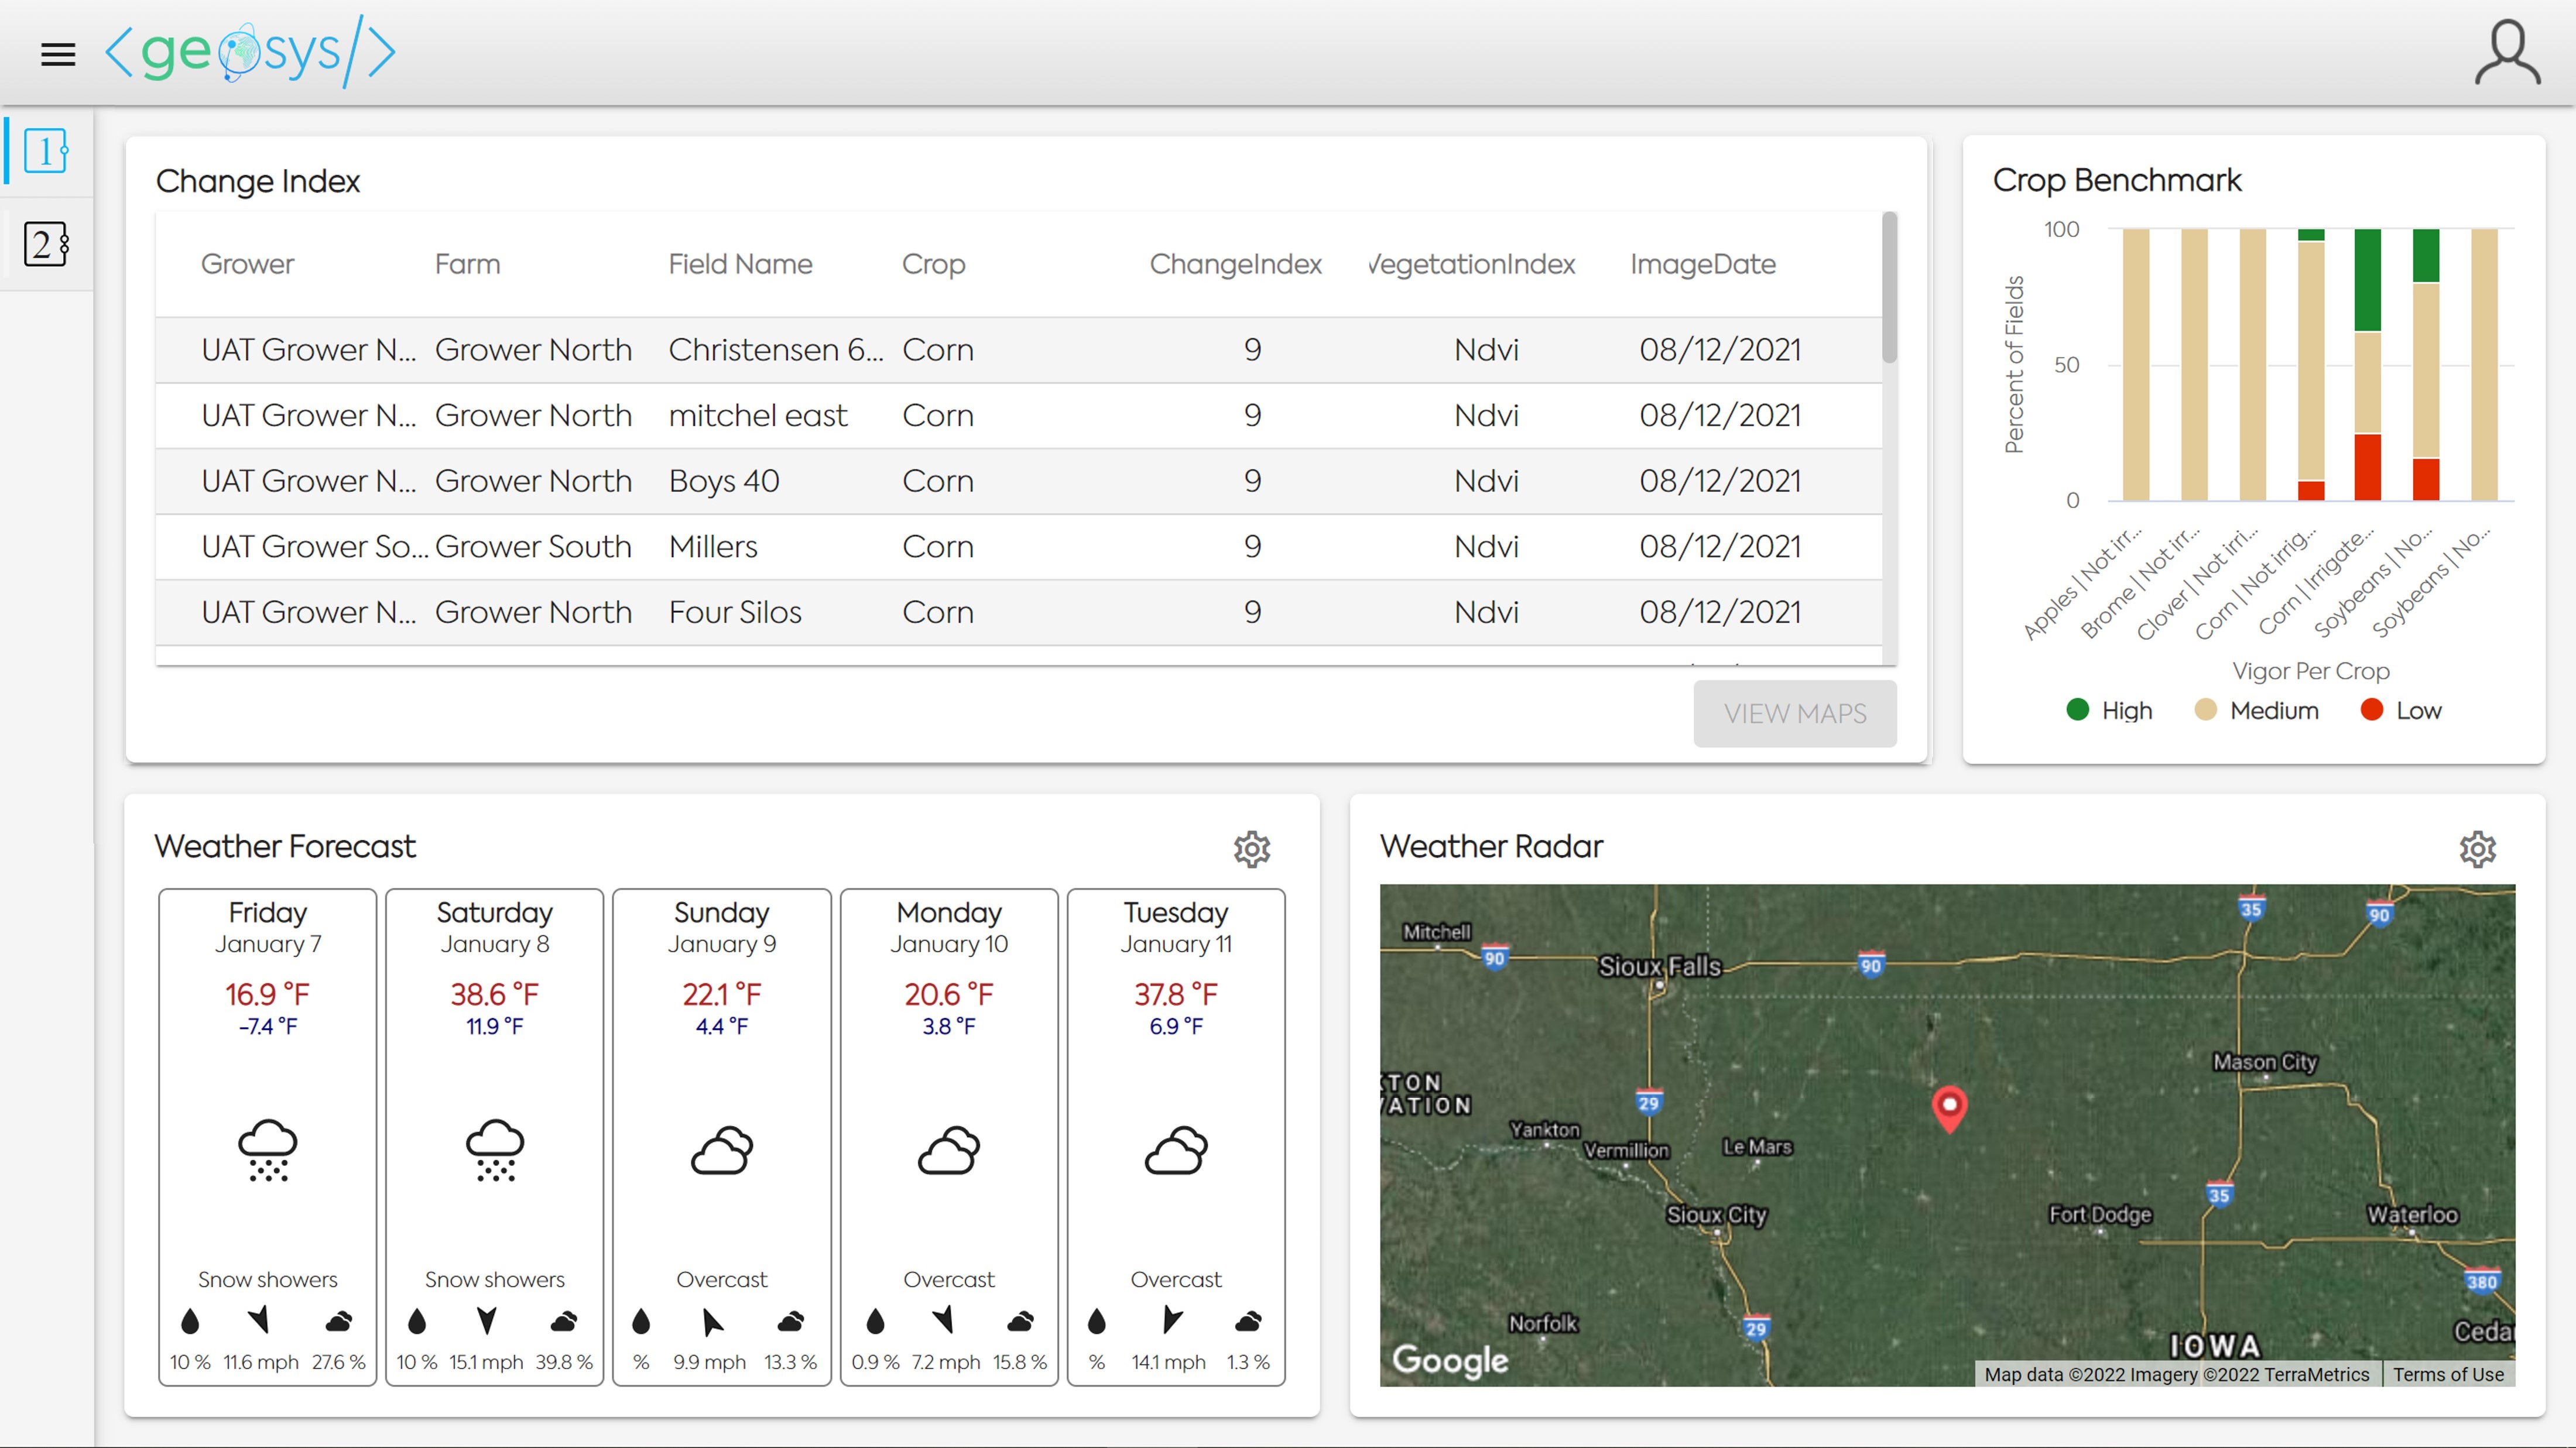
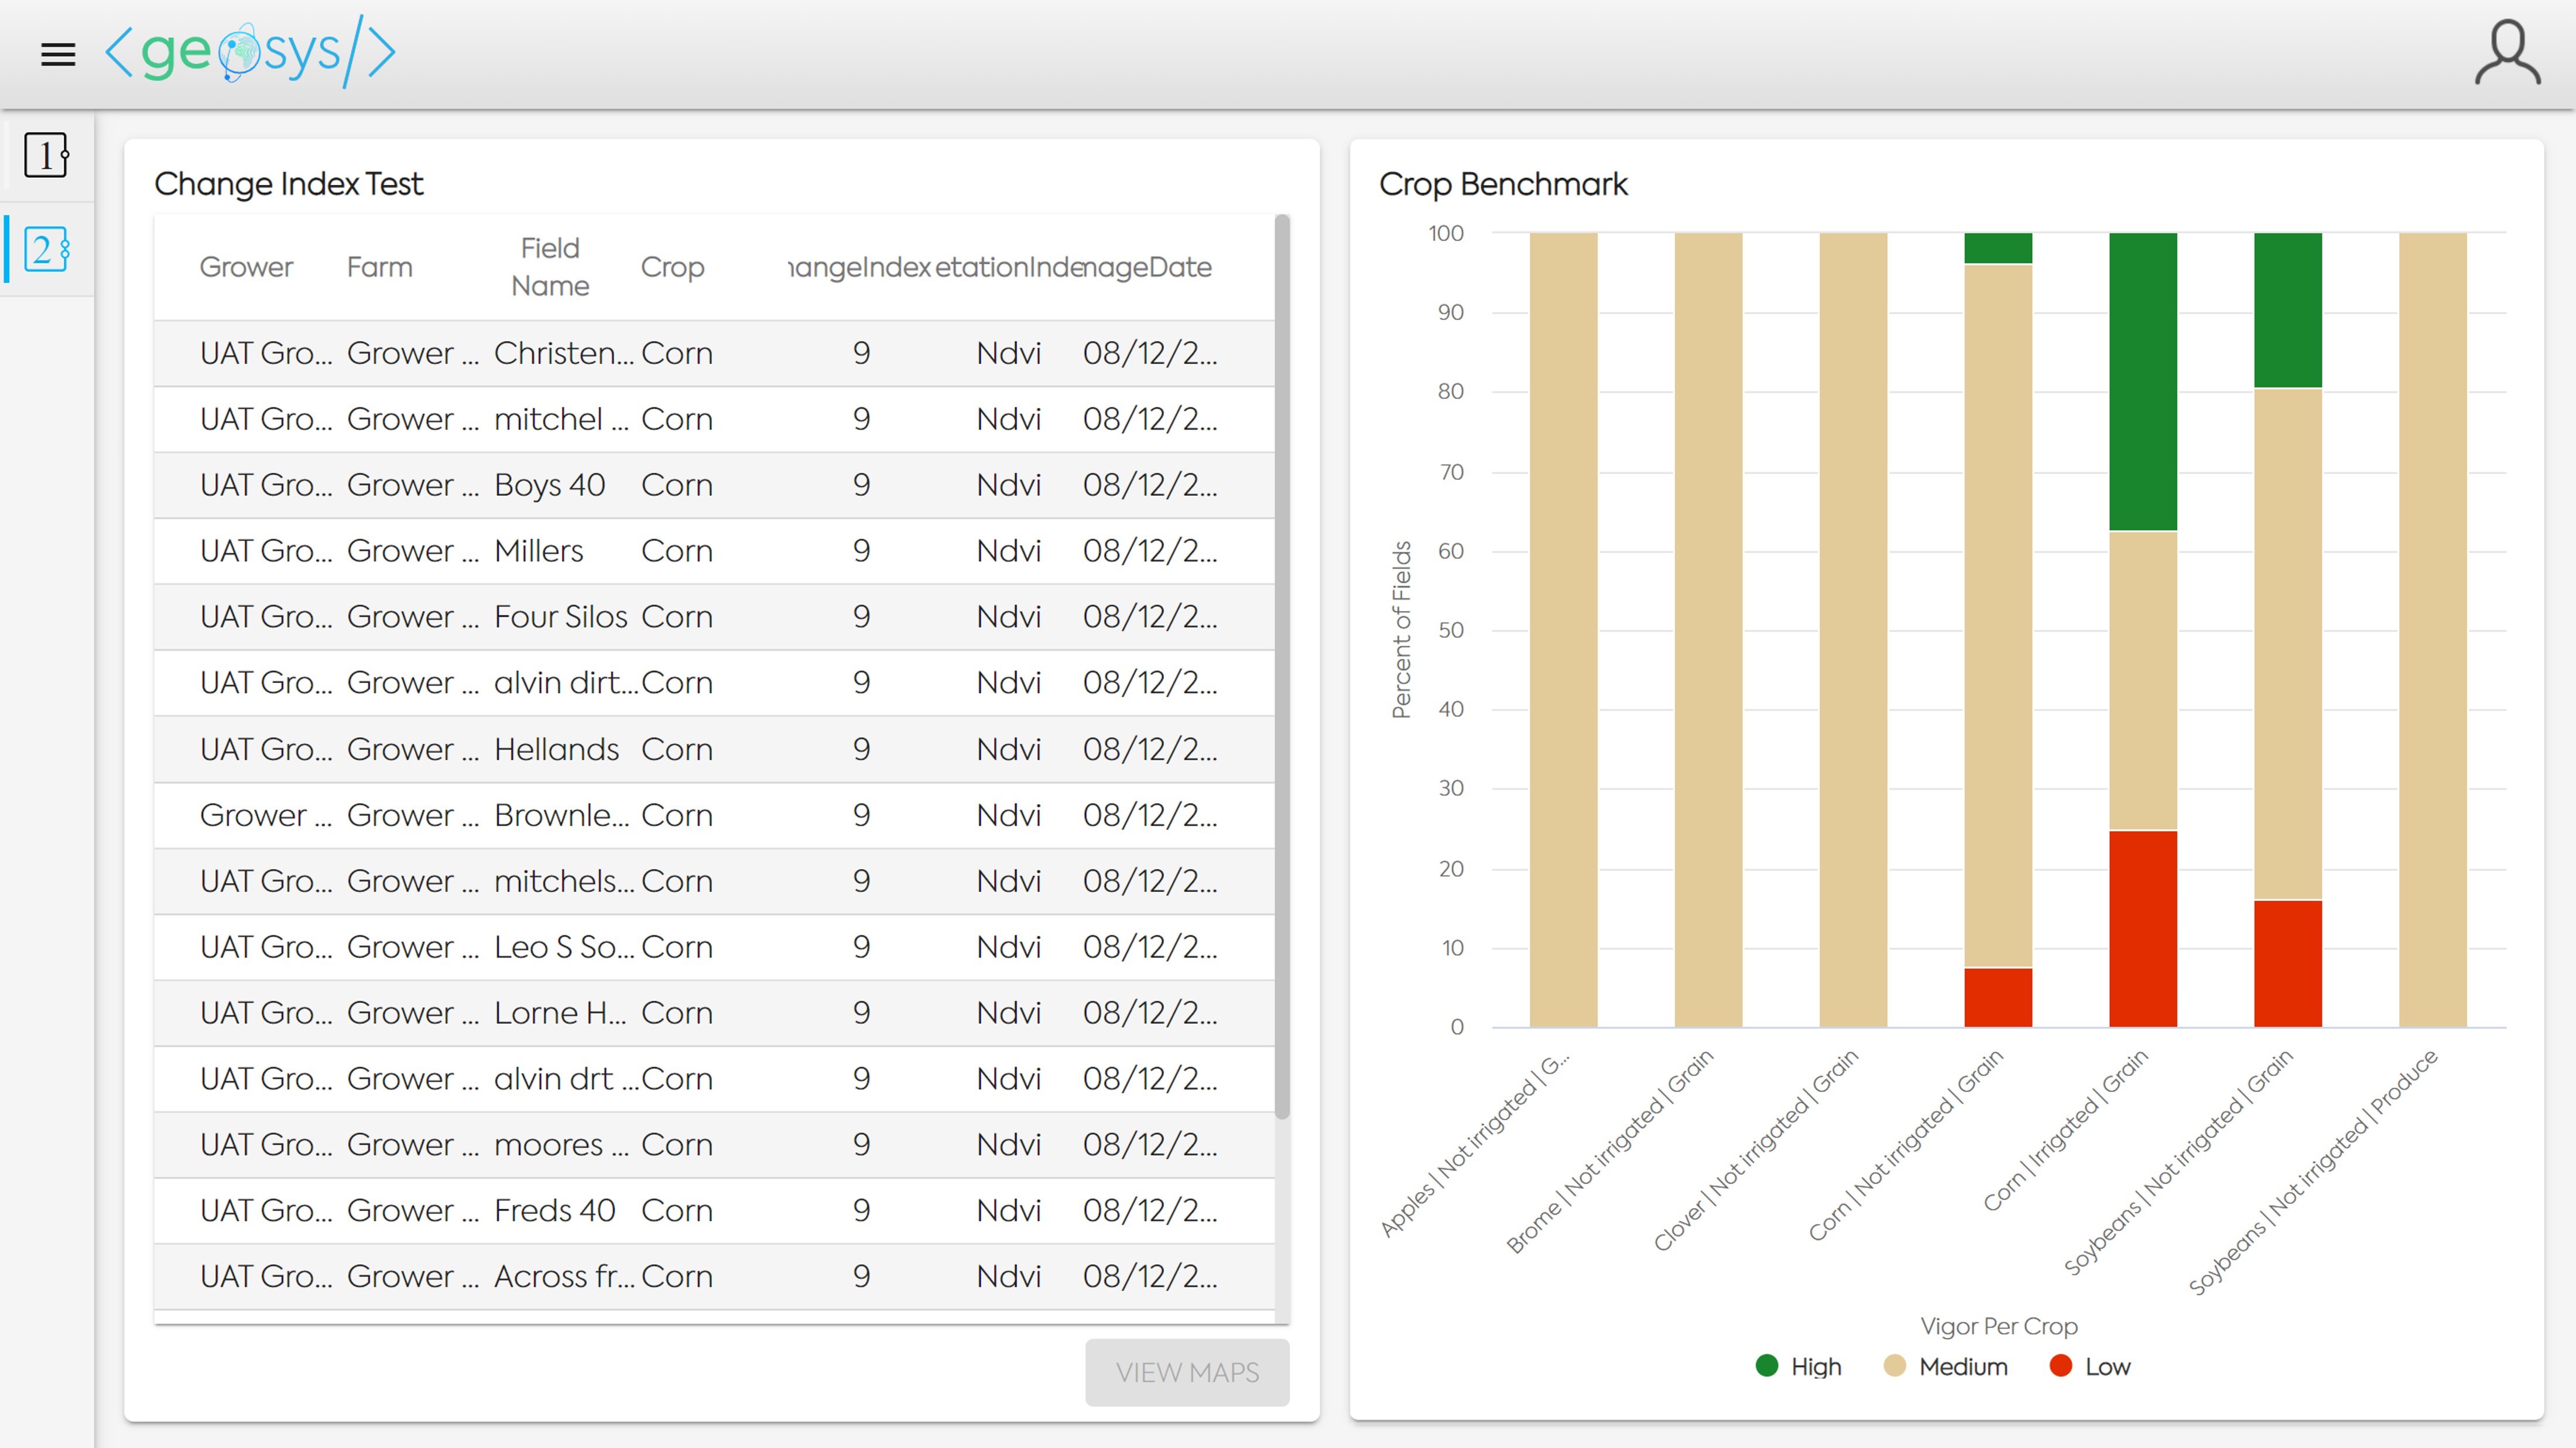
Analytic Table🔗
The Analytic Table widget is configurable to display a Geosys analytic for any aggregation level and in any order.
The most common use is to show the fields with the highest Change Index value on their most recent image.
Clicking on a field in the table will enable a button direct the user to data about the selected field.
In the example below, clicking on the "View Maps" button will open the Map Analysis module with the two images used to create the Change Index value displayed in the table.

Crop Benchmark🔗
The Crop Benchmark widget displays an aggregation of all the fields subscribed to the NDVI Crop Benchmark and their current status.
Fields are aggregated based on Crop type, Usage and Irrigation status.
Hovering the cursor over a bar will display more information - a breakdown of the selected entities result.

Hovering your cursor over a bar will show additional information about that Crop. Clicking on a bar in the Crop Benchmark widget will open the Crop Monitoring module with active field filters that match the Crop Type, Usage and Irrigation which was displayed on the field.

Weather Forecast🔗
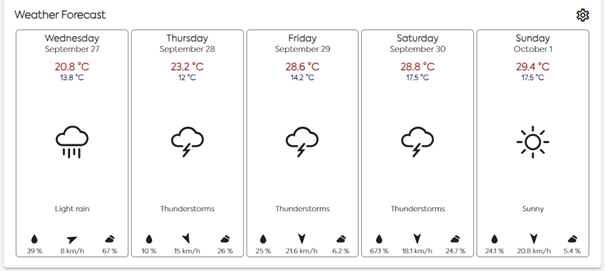
The Weather Forecast widget provides a five day weather forecast for the user's preferred location.
Forecast information provided includes: * High/Low Temperature * Weather Indicator icon and description * Precipitation Probablity Percentage * Average Wind Speed * Cloud Cover Percentage

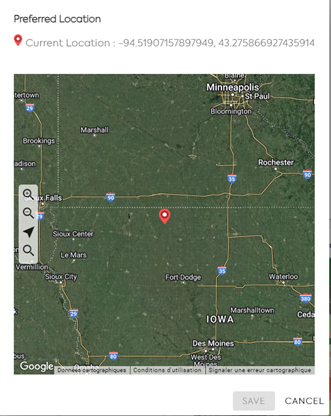
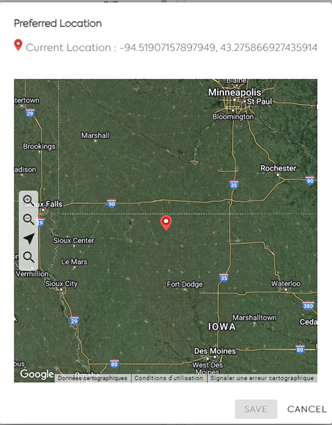
To change the location of the Forecast a user can click on the Settings icon in the top right of the widget to open the screen below.
In the example, the user will click on the map to reset and save their preferred location.

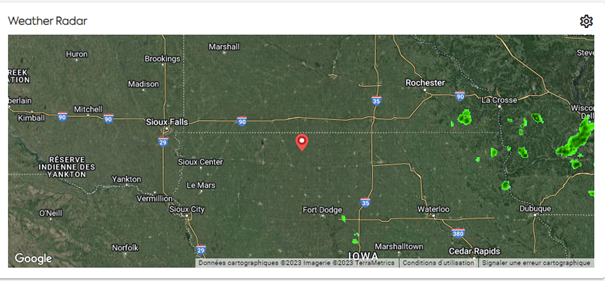
Weather Radar🔗
The Weather Radar widget allows the user to view a radar map near their preferred location.
The Weather Radar widget is only available for users located in the United States, Canada, Australia and Western Europe.
The user can zoom in/out and pan the map to view more of the radar data.

To change the location of the Radar a user can click on the Settings icon in the top right of the widget to open the Preferred Location window, in the same way as the Weather Forecast wideget in the example above.
Favorite Regional Monitoring Map🔗
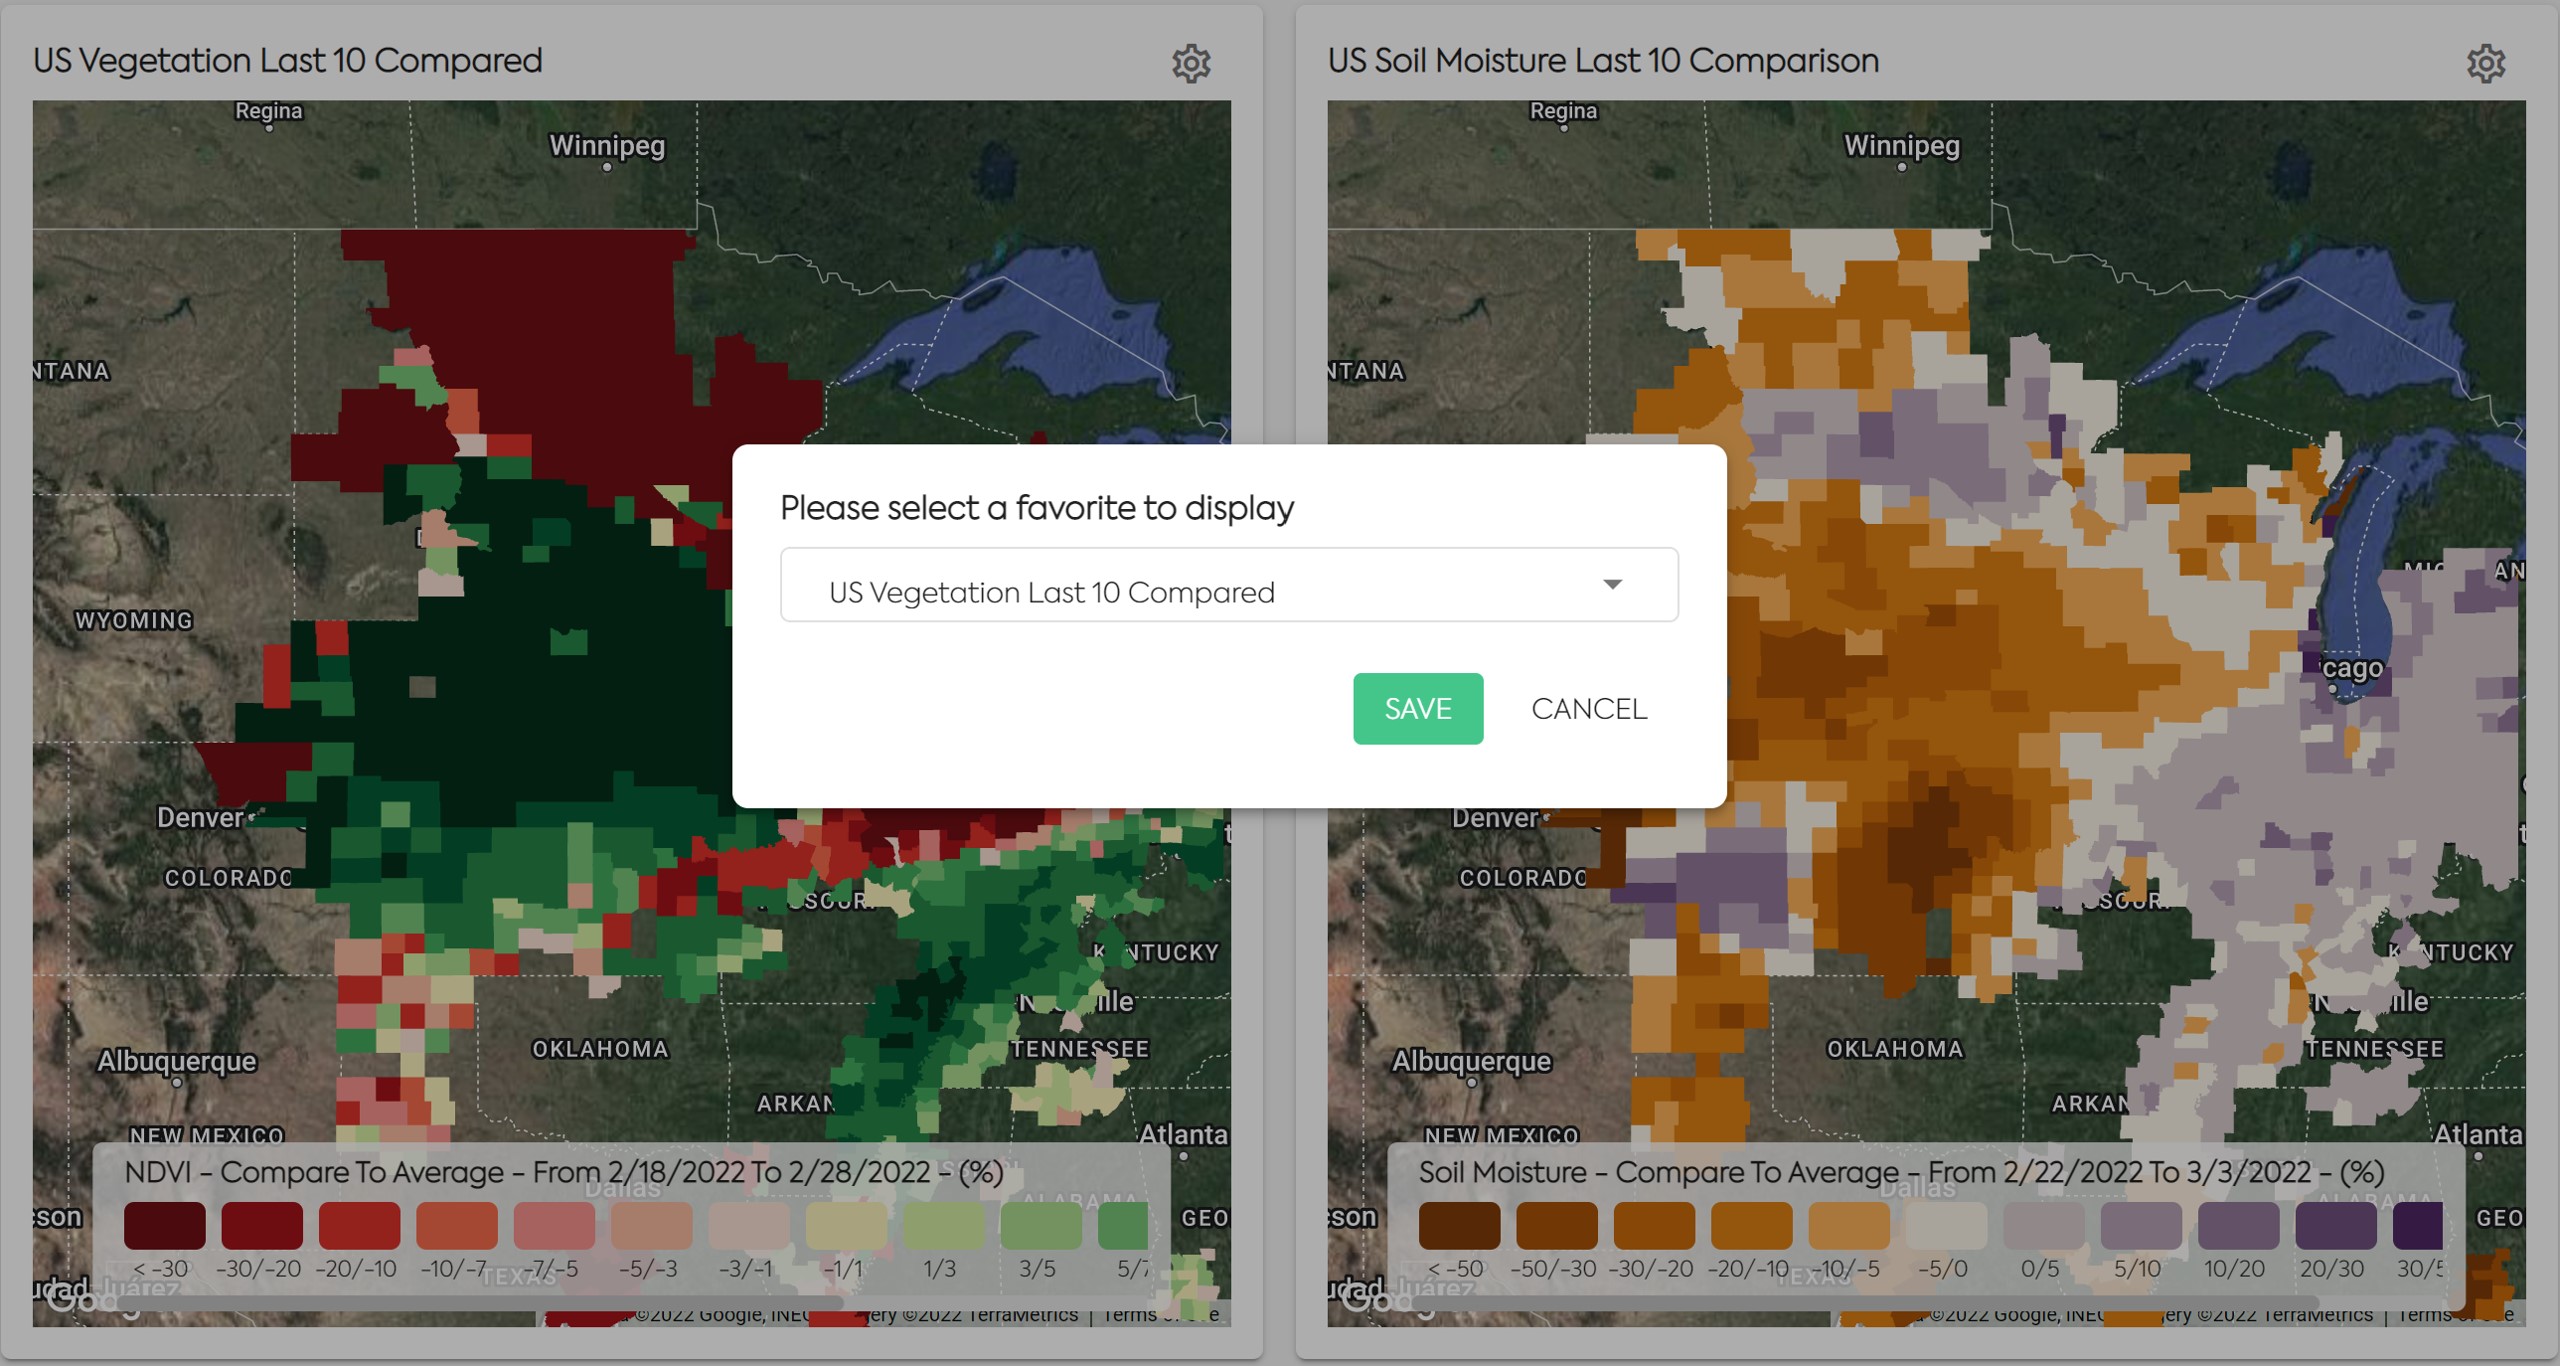
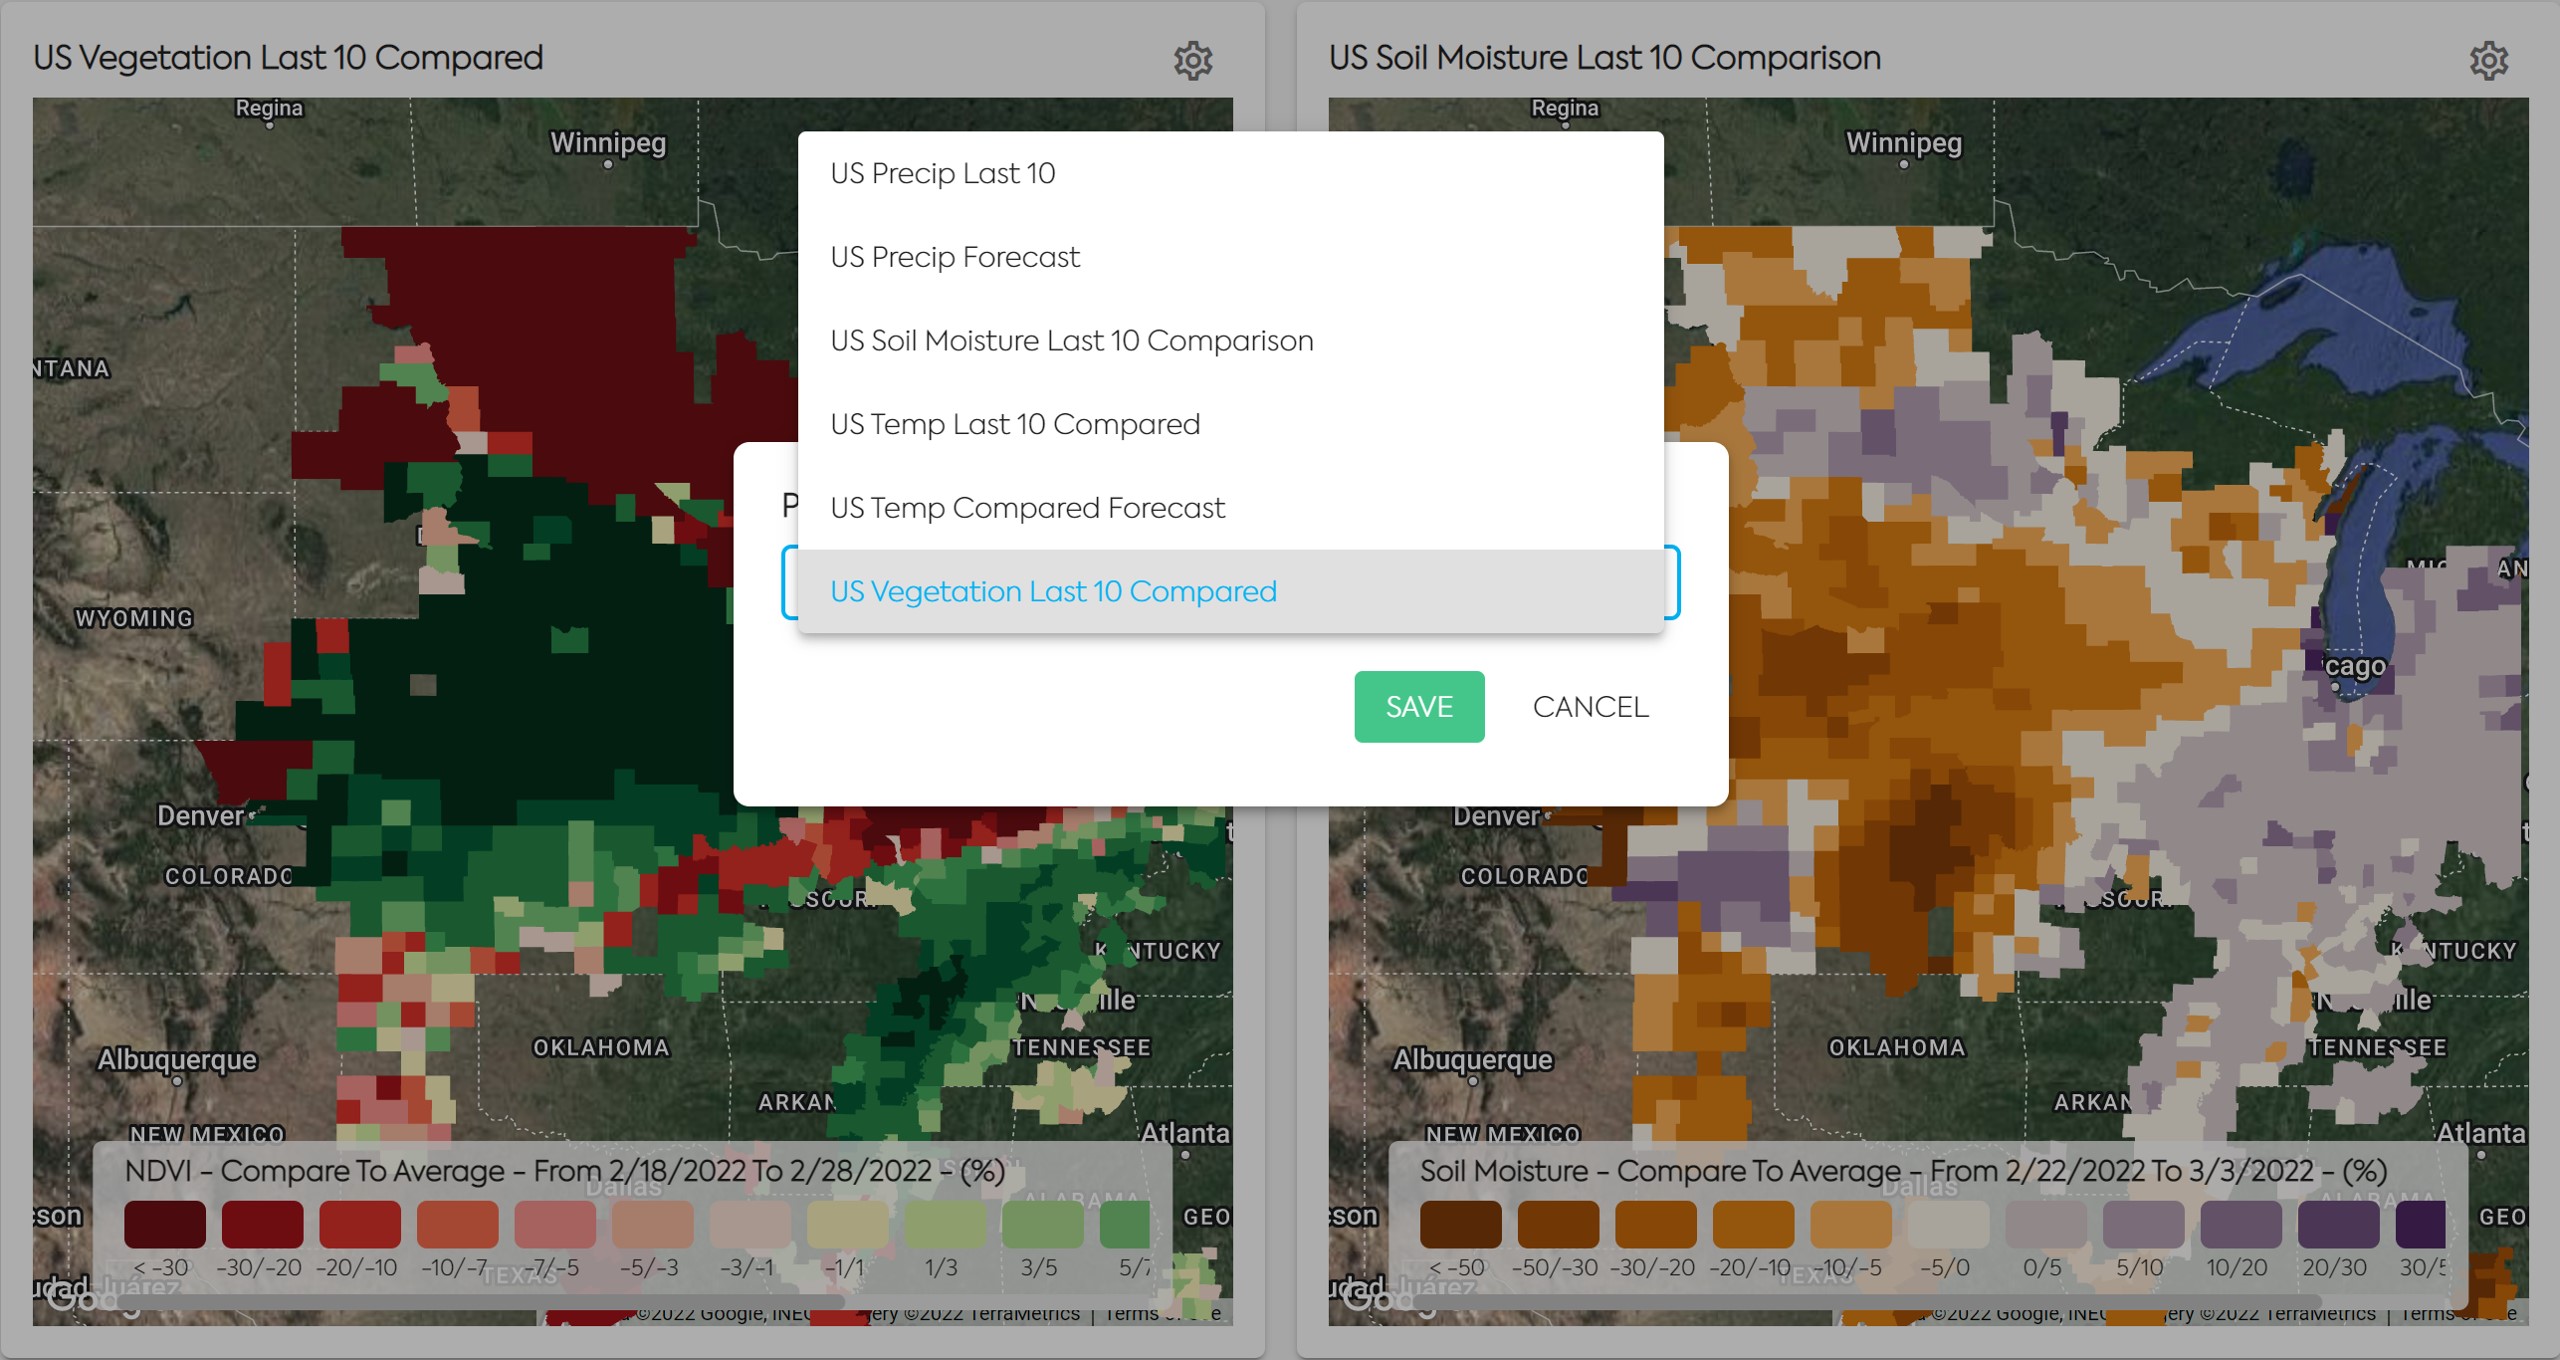
The Favorite Regional Monitoring Map widget allows users to see a quick view of their Favorite Maps.
Clicking on the Map in the widget will open the Monitoring Module with the parameters saved in the Favorite applied to the larger map view.
To change the map displayed, click on the Settings icon in the top right of the Favorite Regional Monitoring Map widget. Then you will be able to see a list of all your Favorite Regional Monitoring Maps. You can create more Favorites in the Monitoring module.
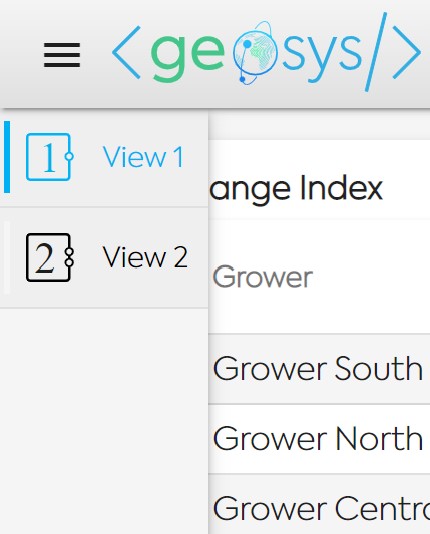
2. Views🔗
The Home Page has multiple views that a user can display
Each view is a customizable group of widgets, that will allow the user to organize their analytics and maps of interest.
To switch to a different view, you simply click on the corresponding figure on the left panel of the Home Page.
3. Demo Account Analytics Description🔗
The Home Page of the automated Demo Account has Mupltiple Views. Multiple analytics are available on the views. Here are the description of these analytics:
VIEW 1 - AGRONOMY🔗
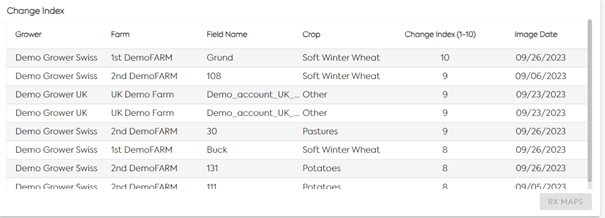
CHANGE INDEX
Quickly see rates of change and easily review side-by-side comparisons of relevant images:
- Analyzes the level of change from the previous image within a 5- to 15-day threshold
- Provides a 0-10 score indicating the level of change within the field using medium resolution imagery
- Score is based on:
- Trend: how much of the field experienced change
- Type: how much variability in the change
- Intensity: overall distribution of NDVI
- Trend: how much of the field experienced change
BENCHMARK
- This widget benchmarks your fields against all other comparable fields in the system.
- The Vigor Status – expressed by colors – helps to determine which fields may be in need of your attention.
- Vigor Indicator shows the level of development of the crop based on current vegetation status : green is above average / yellow is on the average / red is below average.

WEATHER FORECAST
Weather Forecast for the next 5 days. Preferred location can be changed clicking on the top right bottom of the widget.
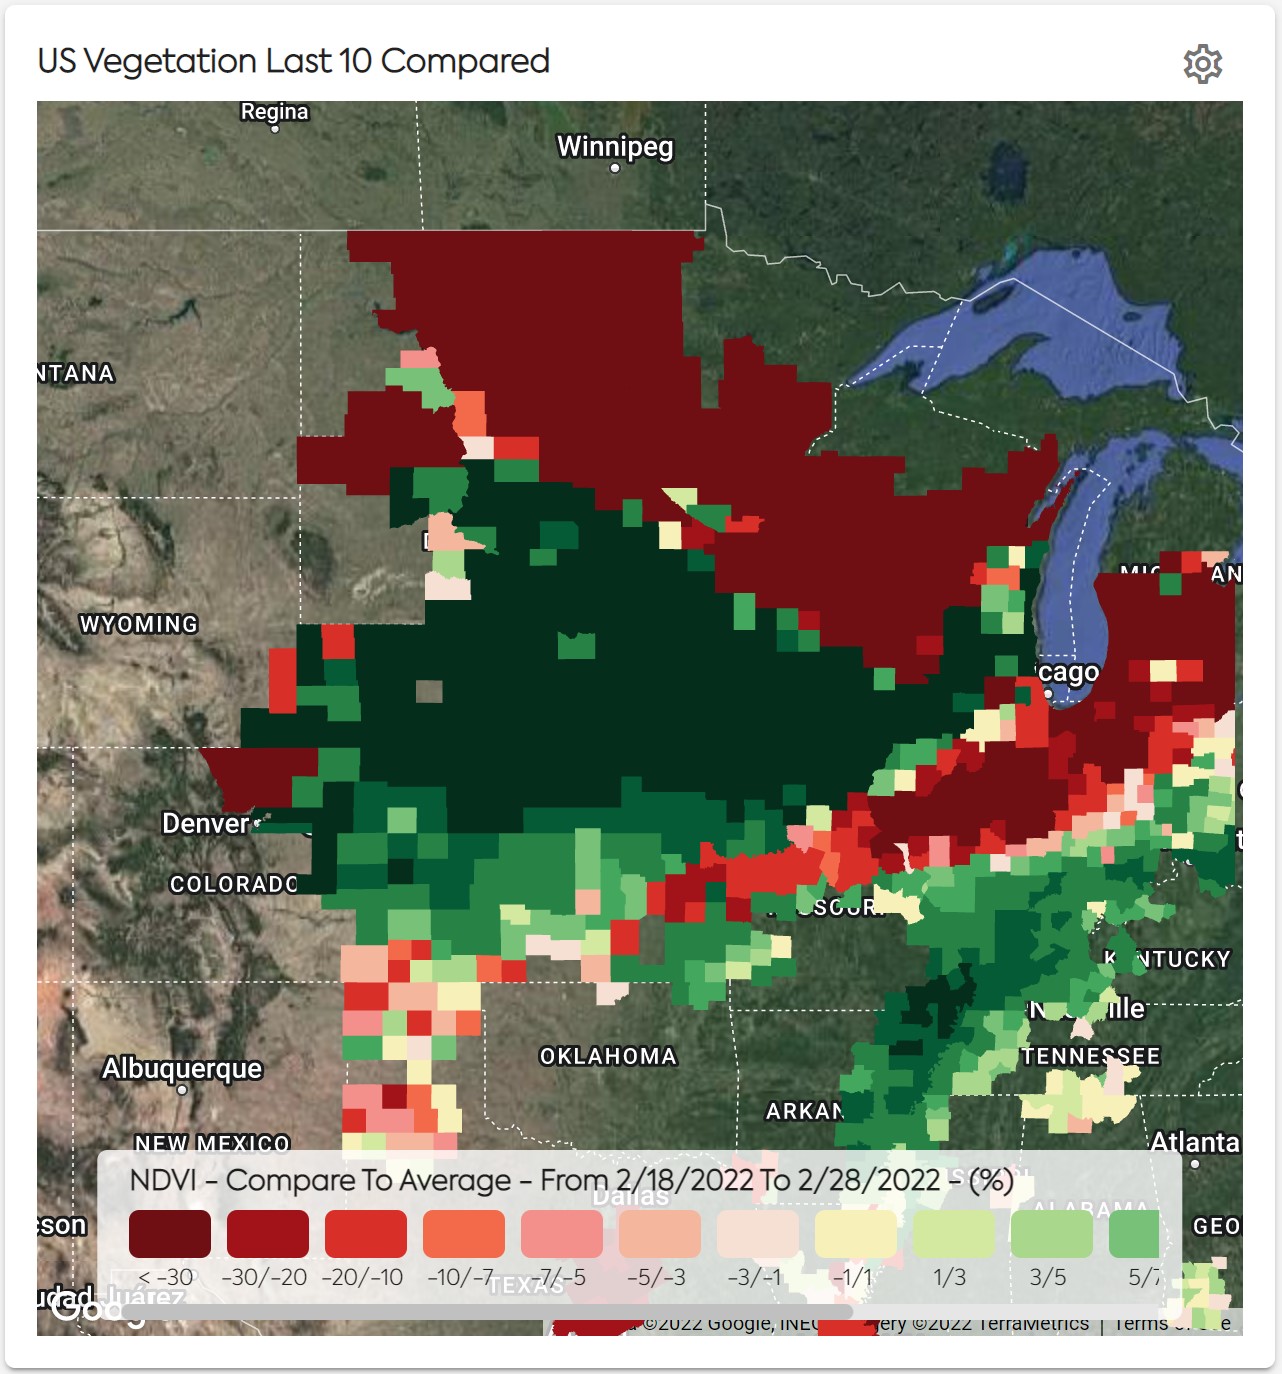
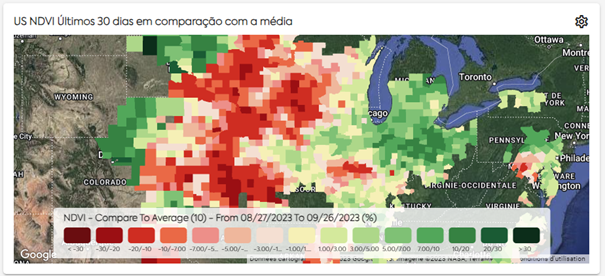
REGIONAL MONITORING FAVORITE
The user can select the favorite he wants to visualize. Here is the comparison of the last 10 days of NDVI compared to the last 15 years average.
VIEW 2 – HISTORICAL FIELD PERFORMANCE🔗
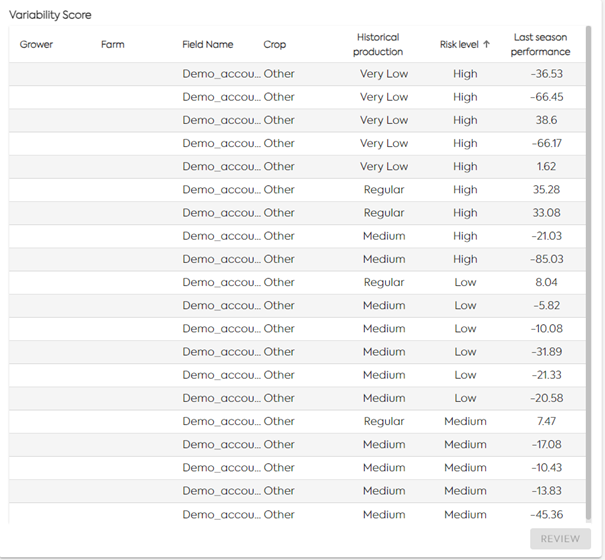
VARIABILITY SCORE
- Historical production = based on last 5 years EarthDaily Agro potential score (using NDVI)
- Very Low = low historical production, field with low potential
- Medium = medium historical production, field with moderate potential
- Regular = regular historical production, field regular potential
- Very Low = low historical production, field with low potential
- Risk level = variability of the last 5 years potential score
- High = highly variable potential score over the last 5 years
- Medium = moderately variable potential score over the last 5 years
- Low = stable potential score stable over the last 5 years
- High = highly variable potential score over the last 5 years
- Last season performance = Comparison of this season's potential score with the average of the last 5 seasons potential score (%).
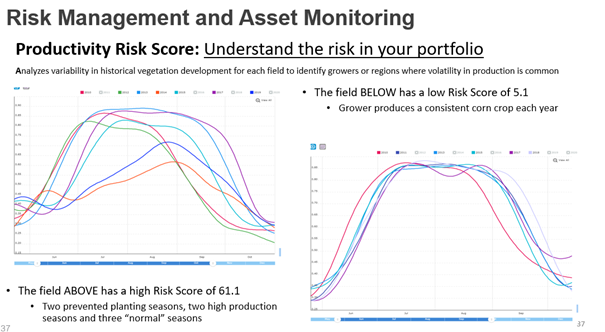
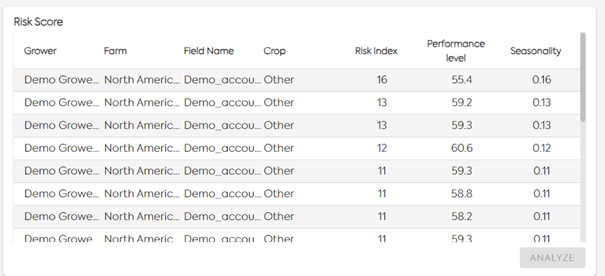
RISK SCORE
- Risk index is a score, computed at field level, based on the coefficient of variation of NDVI Time Series on a selected number of years:
- Lower than 20 = low risk index = consistent field, no variability on the crop development over the last years
- 20-30 = medium risk index = medium variability on the crop development over the last years field, detected but not significantly
- Higher than 30 = high risk index = high variability on the crop development over the last years
- Lower than 20 = low risk index = consistent field, no variability on the crop development over the last years
- Performance level = average of the cumulative NDVI above a threshold over the last years
- Seasonality = coefficient of variation over the last years
- Computed for the last 10 years In this example
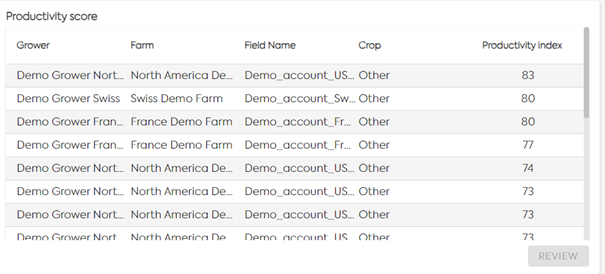
PRODUCTIVITY SCORE
- The average NDVI value is calculated for each image used in the SAMZ creation, taking into account all the pixels that are included within the field boundaries.
- The Productivity Index is between 0 and 100.
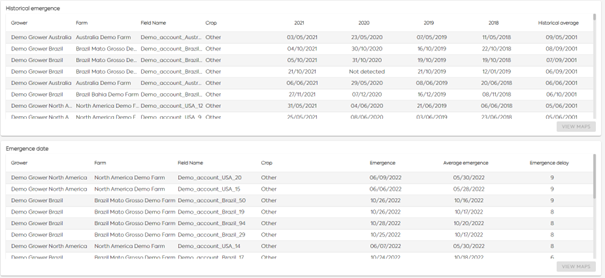
VIEW 3 – EMERGENCE MONITORING🔗
HISTORICAL AND IN-SEASON EMERGENCE DATE
- Algorithm is based on satellite time series with denoising and smoothing. It evaluates if the growth curve has passed a series of rules defined by the emergence indicators.
- Algorithm provides an emergence status (true/false) and the first date of emergence if detected on the requested period by the user. This algorithm is an IP of EarhDaily Agro.
- Emergence date can be delivered 45 days to 60 days after emergence to have a good confirmation and be sure the delivery date isn’t impacted by unexpected vegetation in the field as weeds.
- Training datasets are not mandatory to deliver required analytics but adding local ground truth improves performance.
VIEW 4 – COMPLIANCE PRE-SEASON🔗
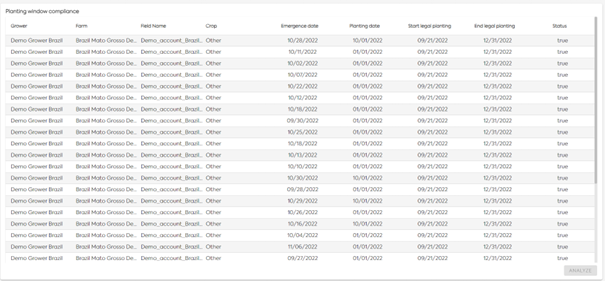
PLANTING WINDOW COMPLIANCE
- Specific to Brazil today
- Thanks to the emergence date detection we compare the estimated sowing/planting date to the start legal planting date and end legal planting date.
- We compute a status per field if the planting date & emergence date are in the legal planting window : true / false
VIEW 5 – IN-SEASON MONITORING🔗
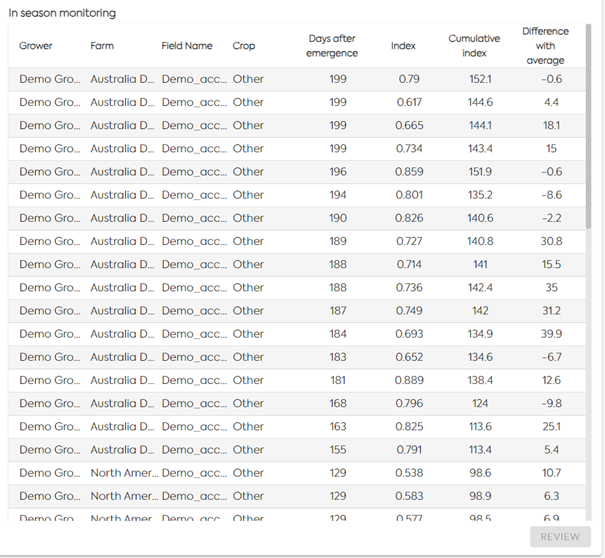
IN-SEASON MONITORING ANALYTICS
- Analytics are computed at field level after emergence detection:
- Number of days after emergence
- Index = NDVI value of the last satellite image
- Cumulative index = Cumulative NDVI from emergence date
- Difference with average = Difference of the in-season cumulative NDVI with the last 5 years average
- Number of days after emergence
WEATHER RADAR
Weather radar displays the risk of rainfall. Preferred location can be changed clicking on the Settings at the top of the widget.
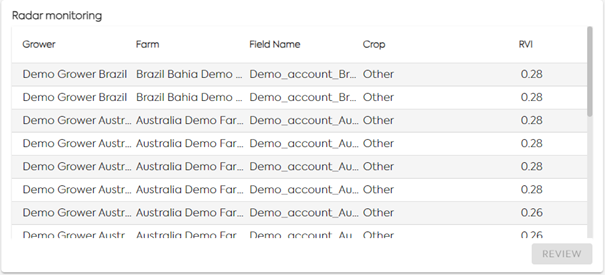
RADAR MONITORING
- Last RVI Sentinel-1 value at field level
- On-demand analytic
VIEW 6 – CROP PERFORMANCE🔗
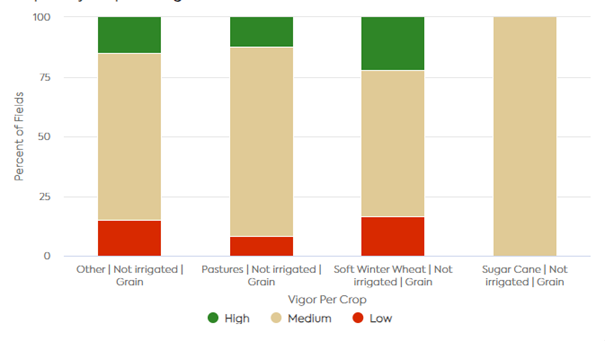
CROP BENCHMARK
- This widget benchmarks your fields against all other comparable fields in the system.
- The Vigor Status – expressed by colors – helps to determine which fields may be in need of your attention.
- Vigor Indicator shows the level of development of the crop based on current vegetation status : green is above average / yellow is on the average / red is below average.
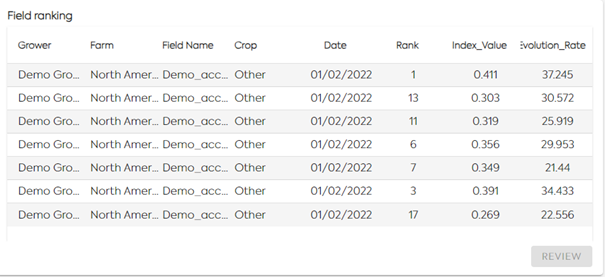
FIELD RANKING
Quickly evaluate the best fields and worst fields to know which fields to review:
- All fields for an individual grower, organized by crop
- Field ranking based on the biomass level derived from vegetation indicator (Index Value)
- Field with highest biomass is ranked 1
- Evolution rate is the evolution of the vegetation indicator compared to 7 days ago
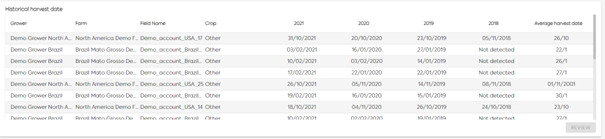
HISTORICAL HARVEST DATE
- Algorithm is based on satellite time series with denoising and smoothing and evaluates if the curve has passed a moving threshold.
- Algorithm provides a harvest status (true/false) and the first date of harvest if detected on the requested period by the user.
- This algorithm is an IP of EarthDaily Agro.
- Harvest date can be delivered some days after harvest to have good confirmation and be sure the delivery date isn’t impacted by undetected cloud or shadow of the cloud in the image.
- Training datasets are not mandatory to deliver required analytics but adding local ground truth improves performance.
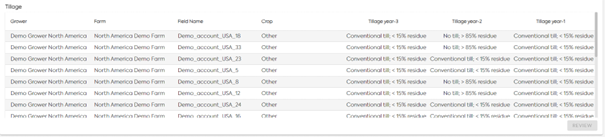
VIEW 7 - SUSTAINABILITY🔗
TILL/NO-TILL DETECTION
- Tillage detection based on remote sensing relies on soil disturbance assessment and crop cover residues on top of the soil.
- The result provided is No-till or Conventional tillage per inter-season at field level. A conventional tillage answer is provided when at least conventional tillage is detected for fall tillage or spring tillage.
- The current technology hasn’t been scientifically assessed on “intermediary practices” for the moment (mulch till, reduced till, strip-till etc.).
- Result is provided once a year – for winter crop rotations (analyzing period from August to October).
- Available from 2018 -
- Training datasets are not mandatory to deliver required analytics but adding local ground truth improves performance.
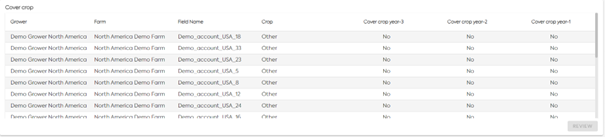
COVER CROP DETECTION
- Cover crop detection is based on Photosynthesis activity measurement at field level.
- The result provided is yes/no per inter-season (winter vegetation cover – whatever if it’s a winter cash crop or a cover crop).
- Result is provided once a year – end of winter/early spring depending on the area of interest (consistency with crop season).
- Available from 2018
- Training datasets are not mandatory to deliver required analytics but adding local ground truth improves performance.