Map Analysis🔗
🚜 Field Selection🔗
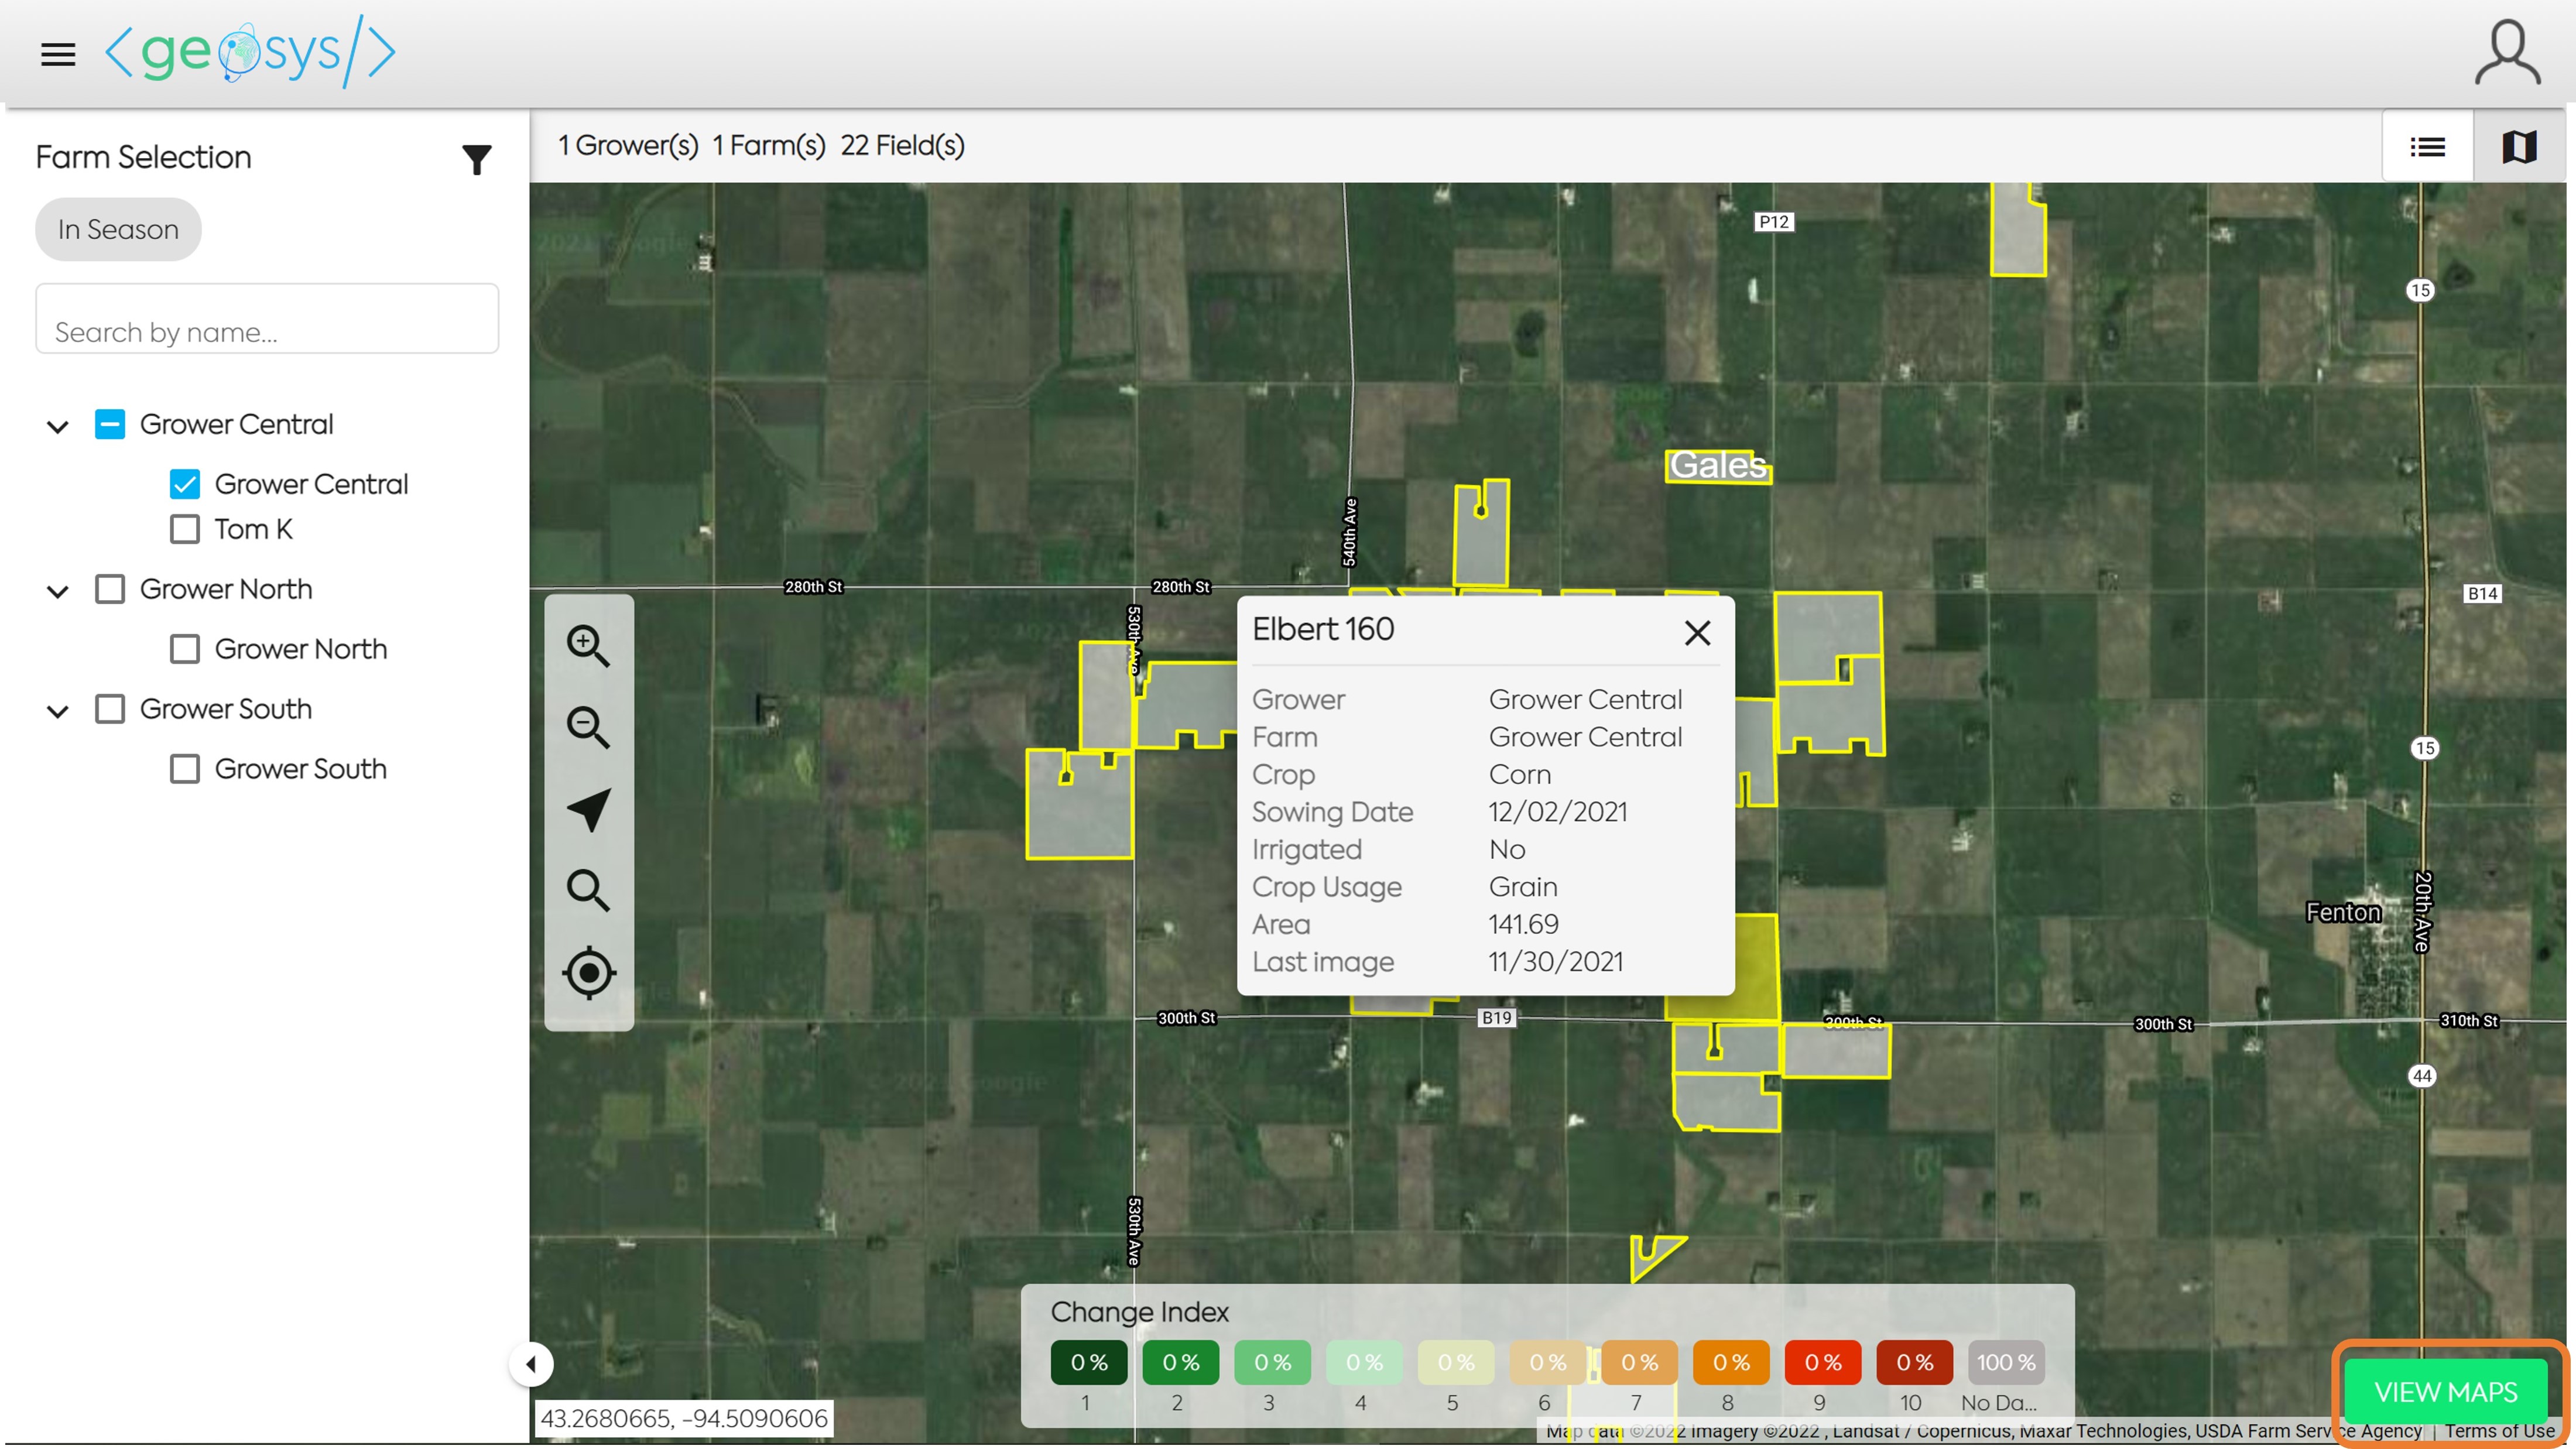
When viewing the Map Analysis Module, you first need to select the Field you would like to view. In Map Analysis, the selection panel will by default display all Growers/Farms which have a field in-season.
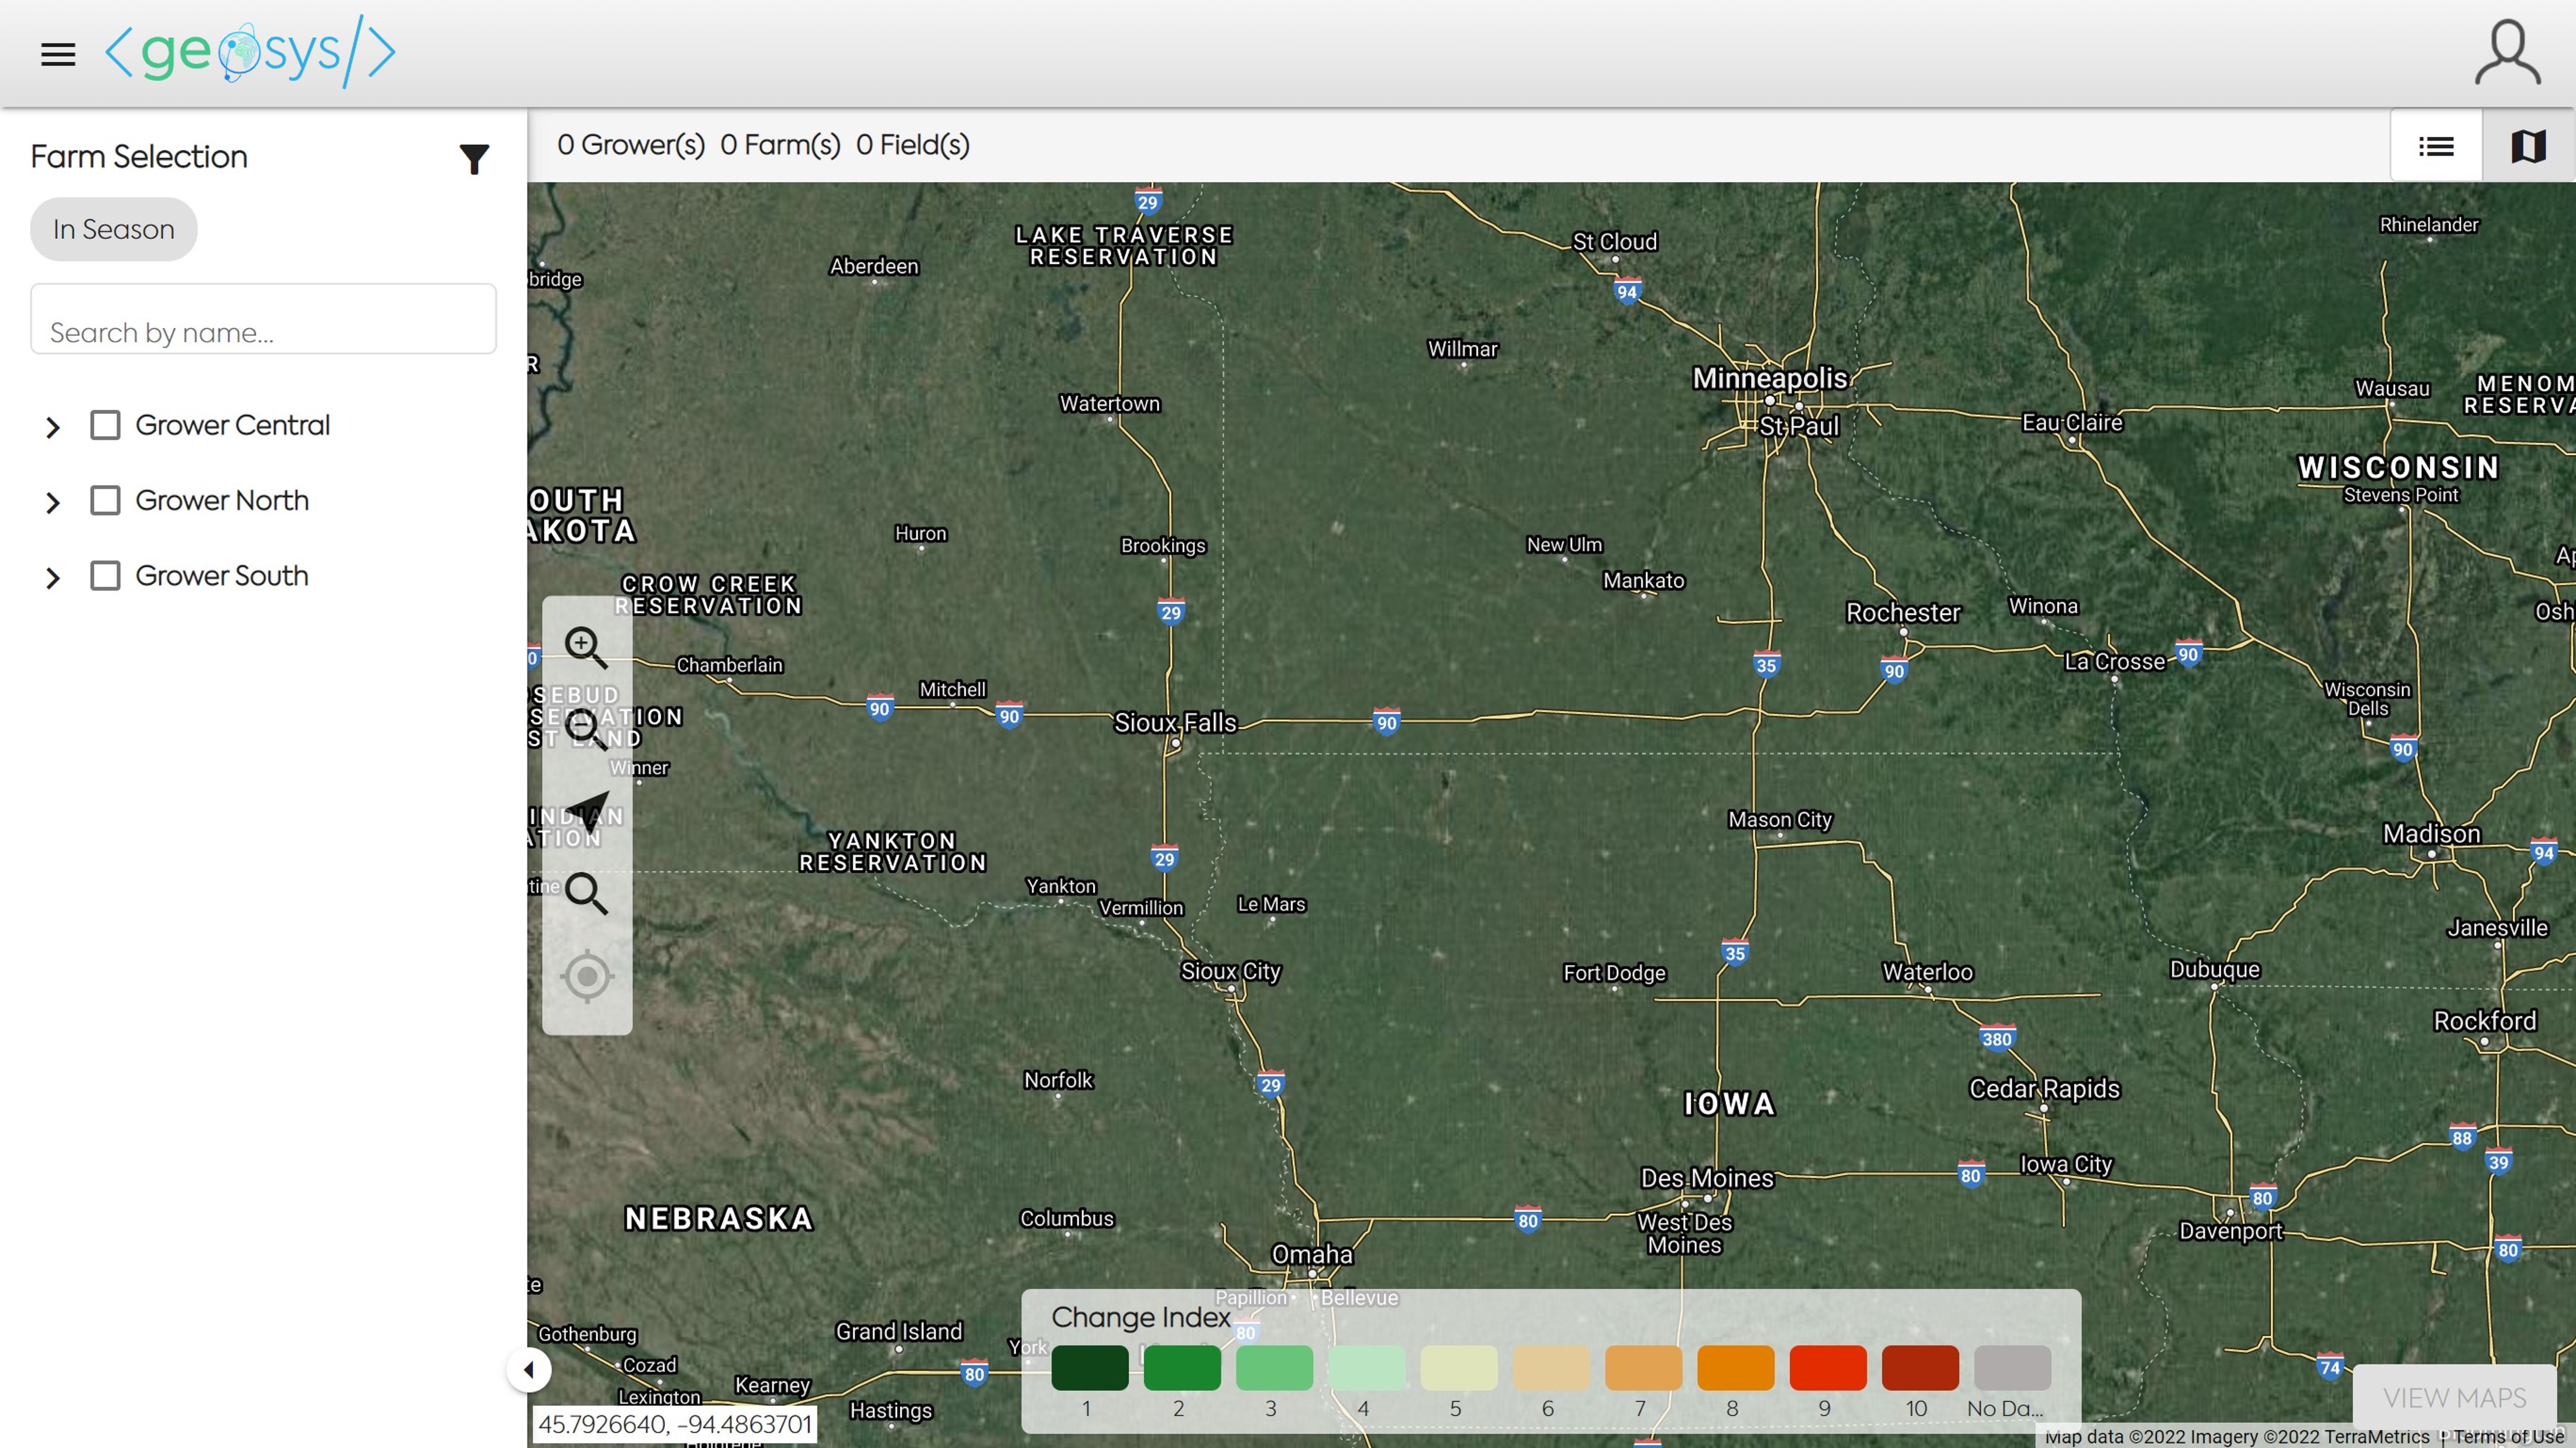
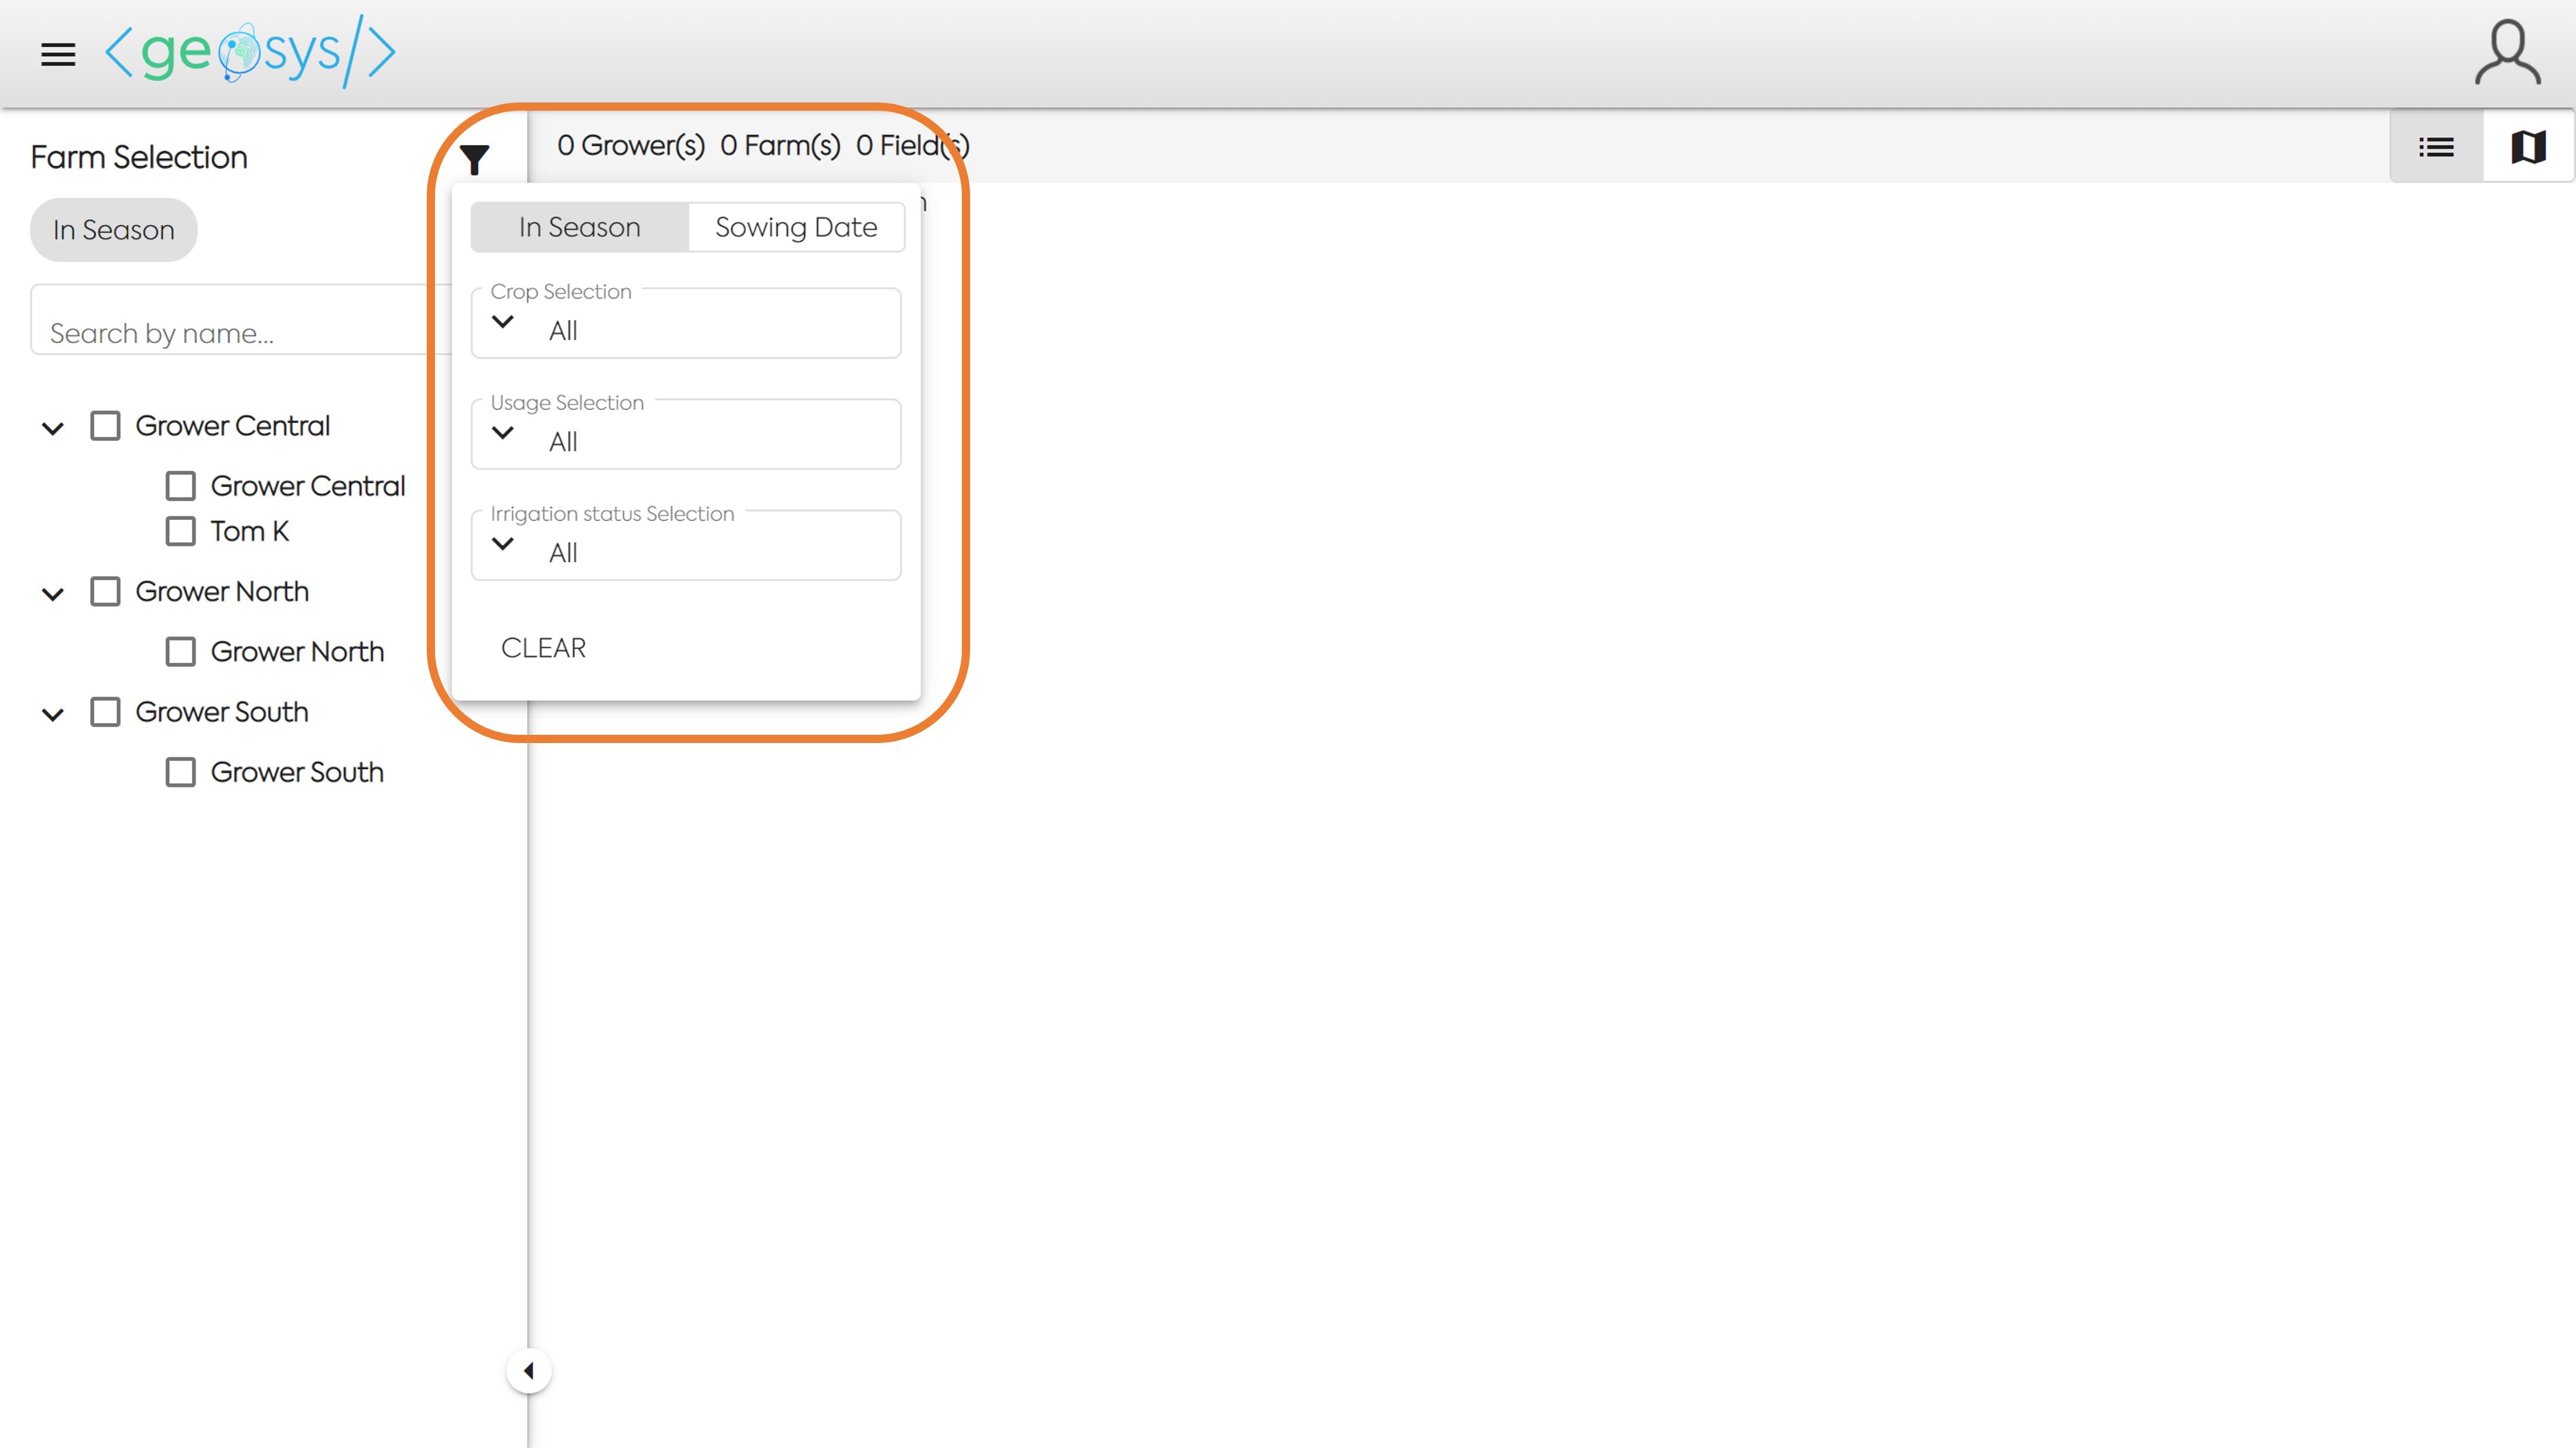
Click on the Filter Icon to view and choose your Grower, Farm, or Field based on In-Season or Sowing Date range, Crop Type, Usage and/or Irrigation Status.
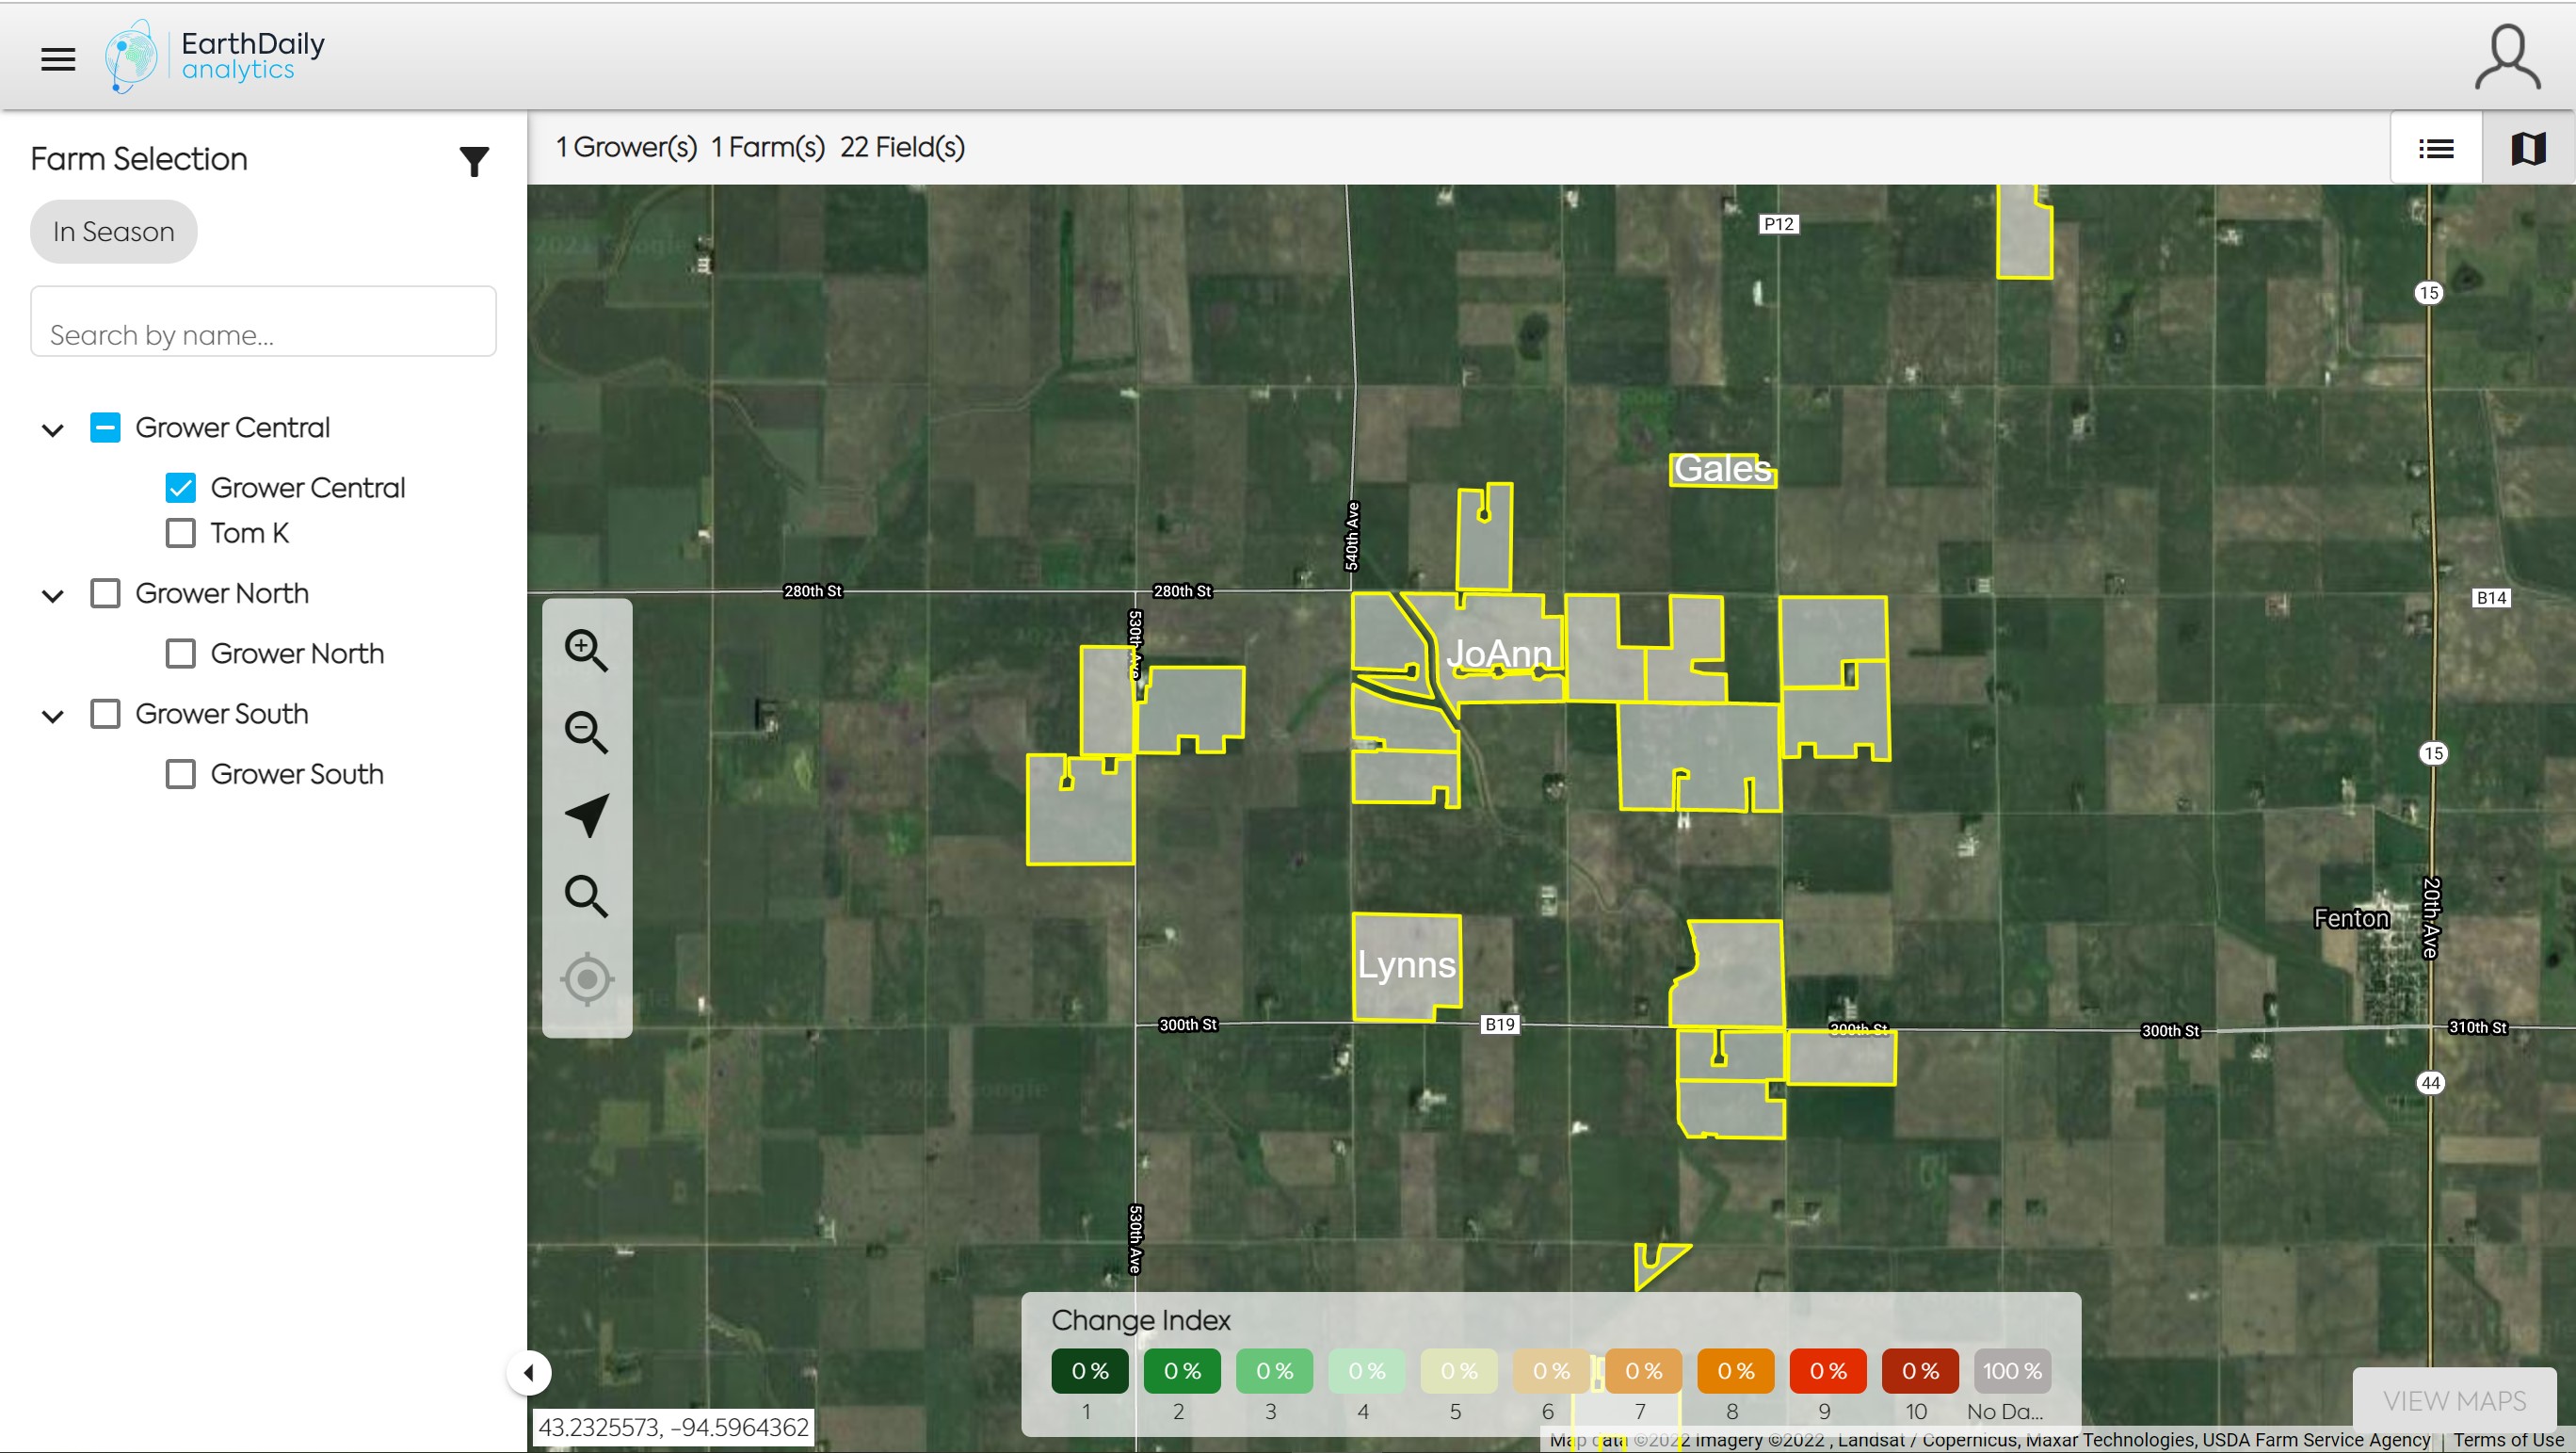
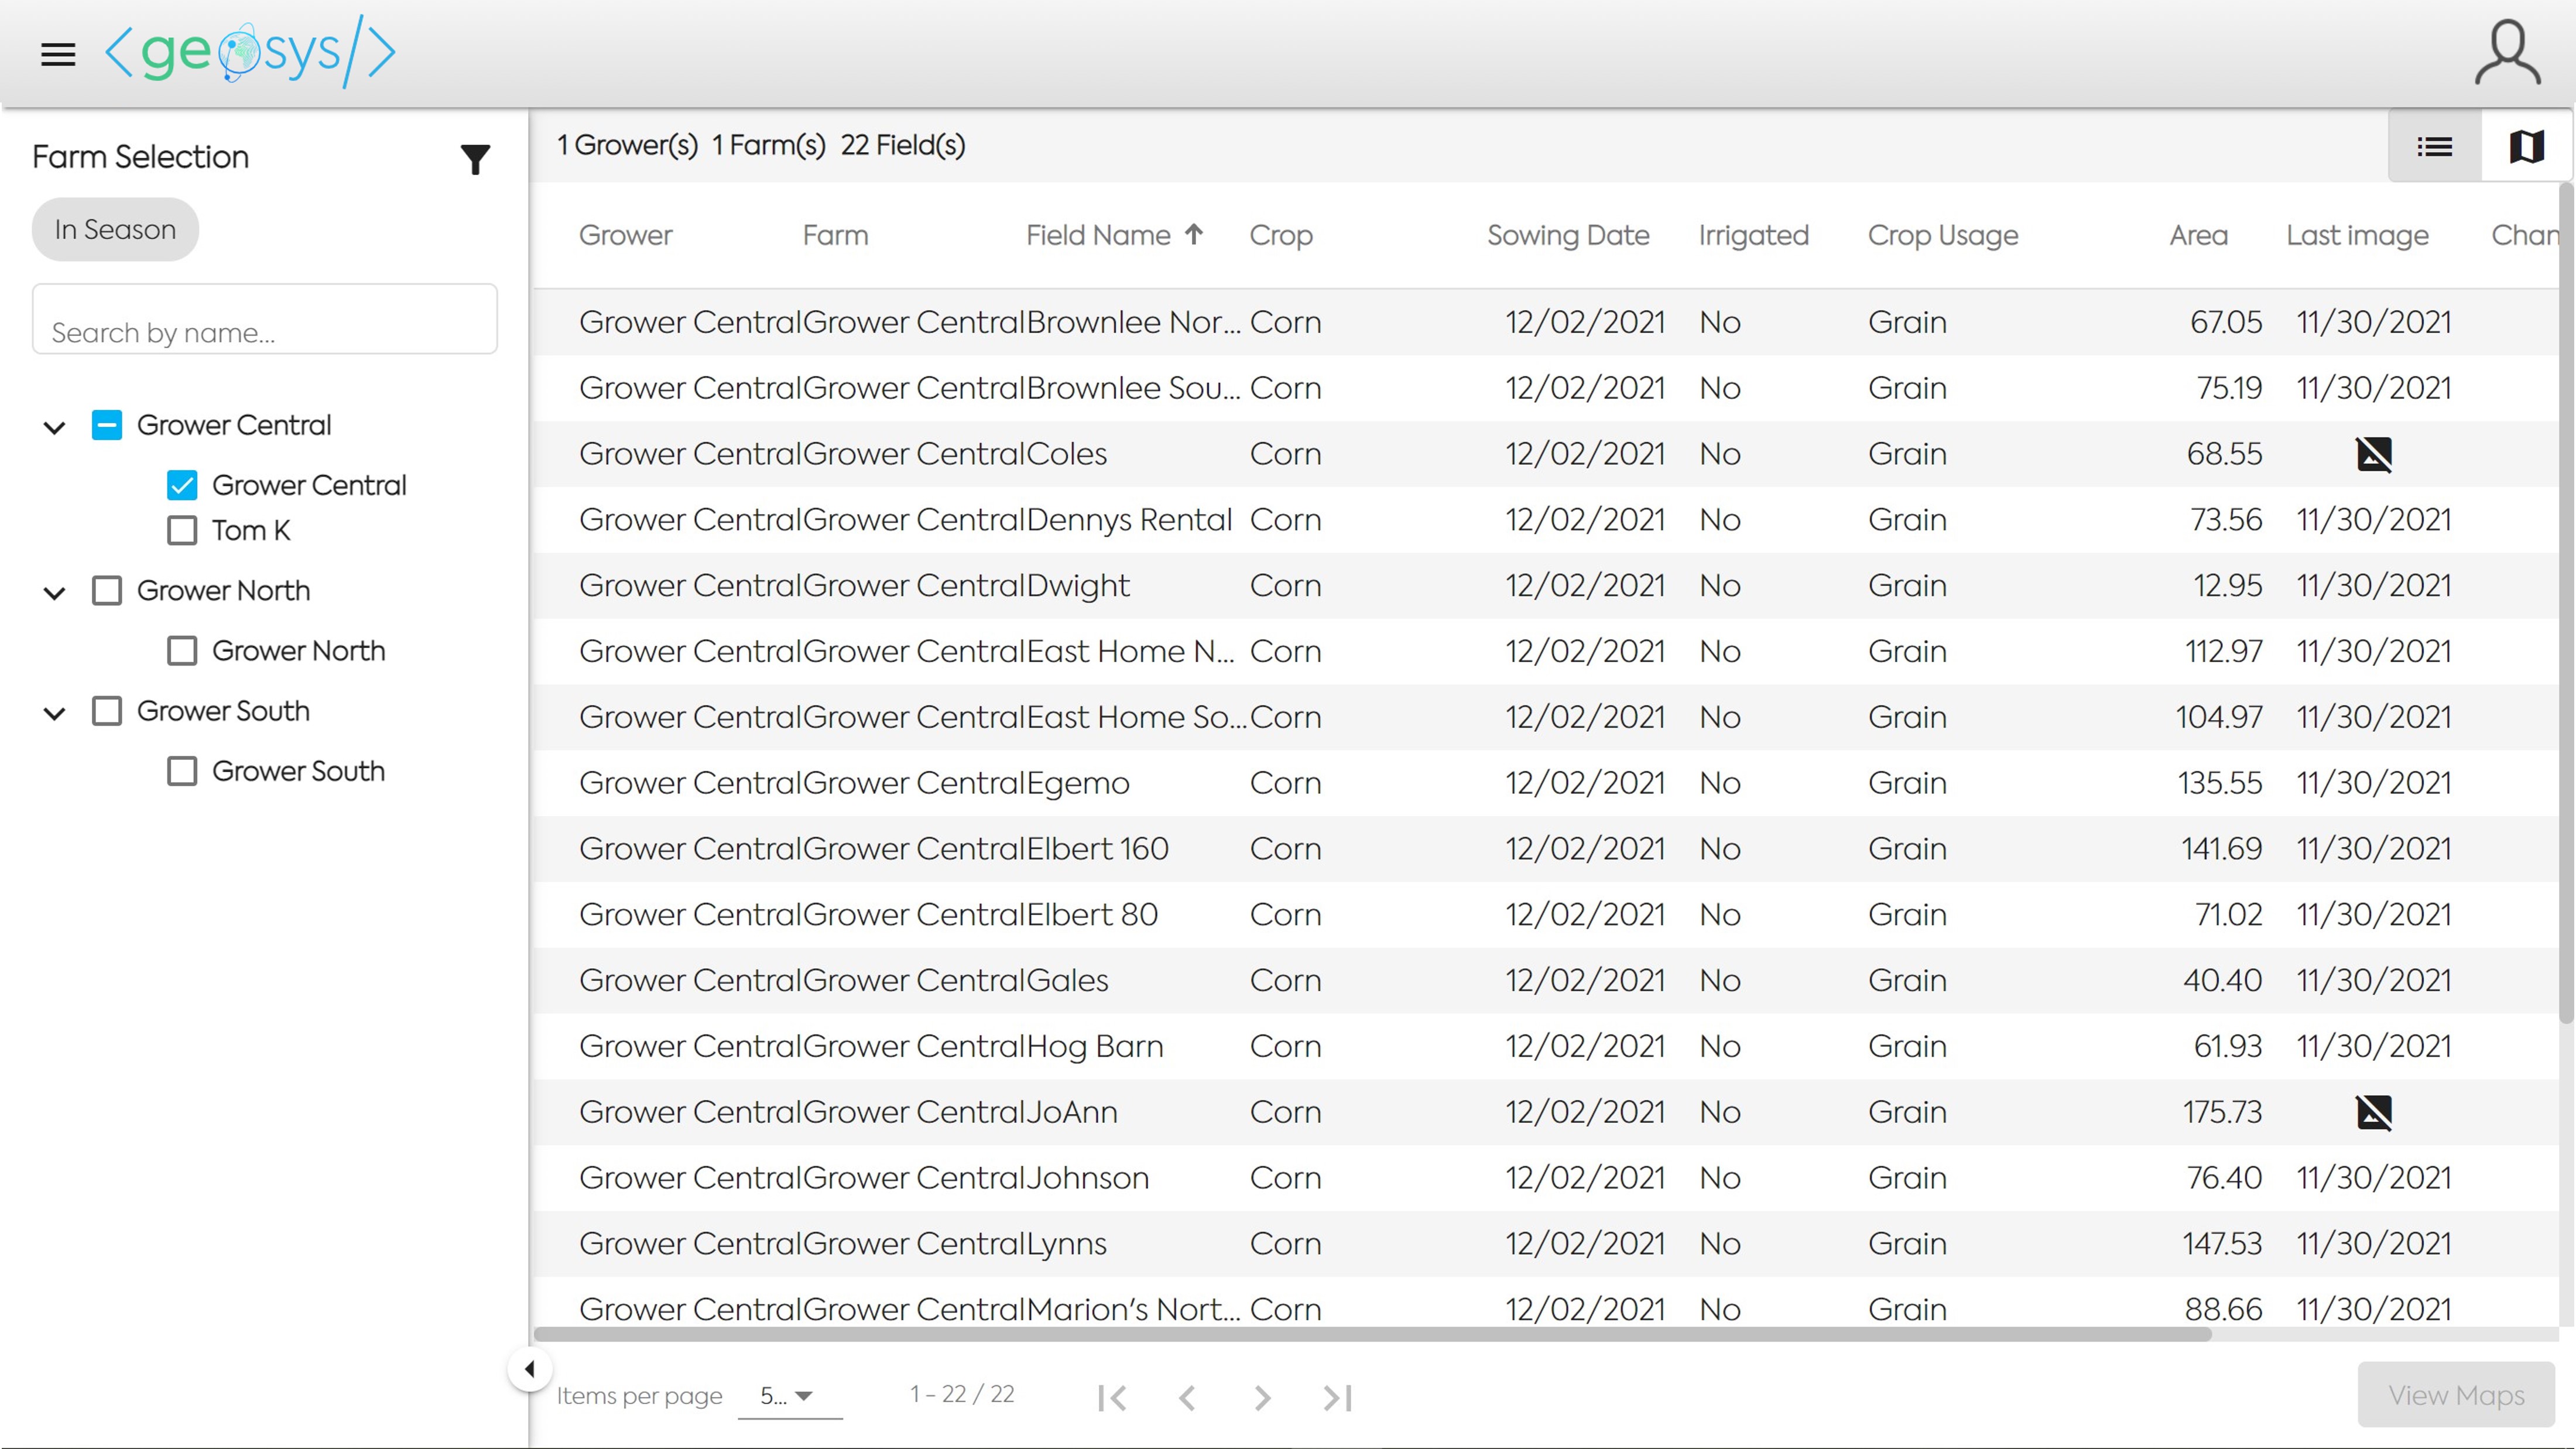
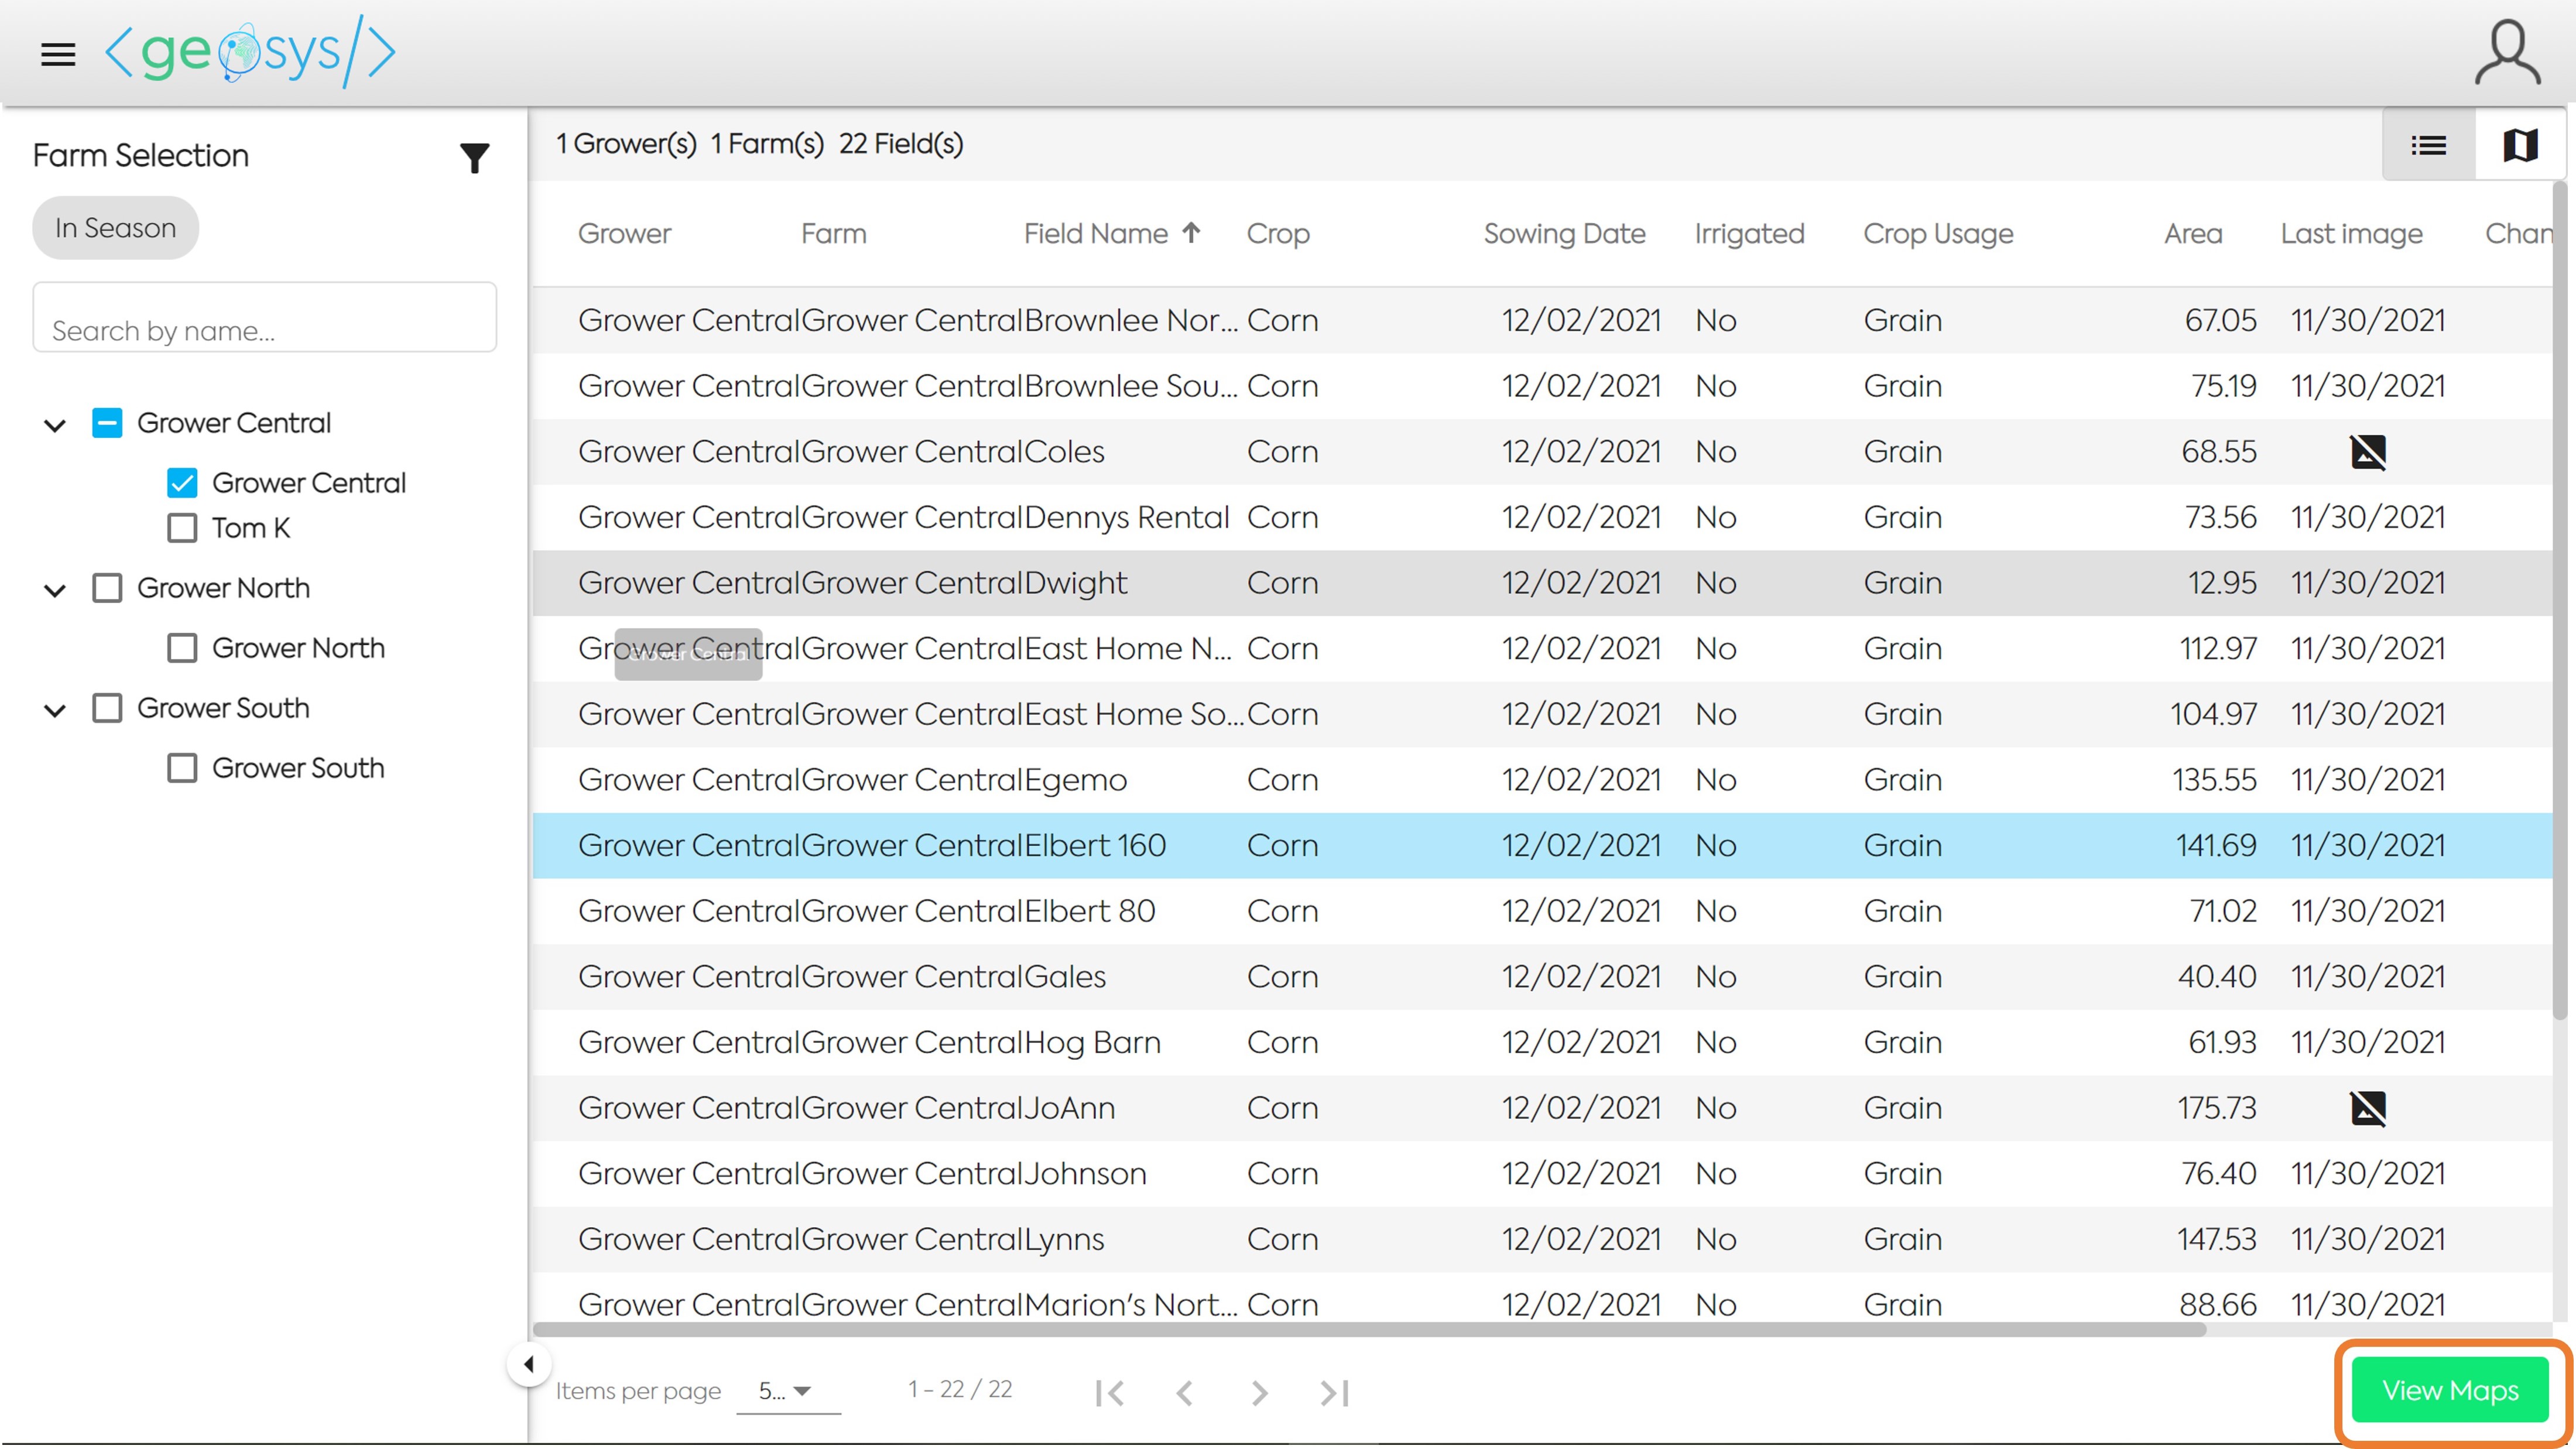
Select one or many Growers/Farms to view their fields in either a Map or Grid view. To toggle between the two views click on the map or list icon in the top right of the screen.
🗺️ View Maps🔗
Select a field and click the View Maps button in the bottom right of the screen to access all the maps available for this individual field.
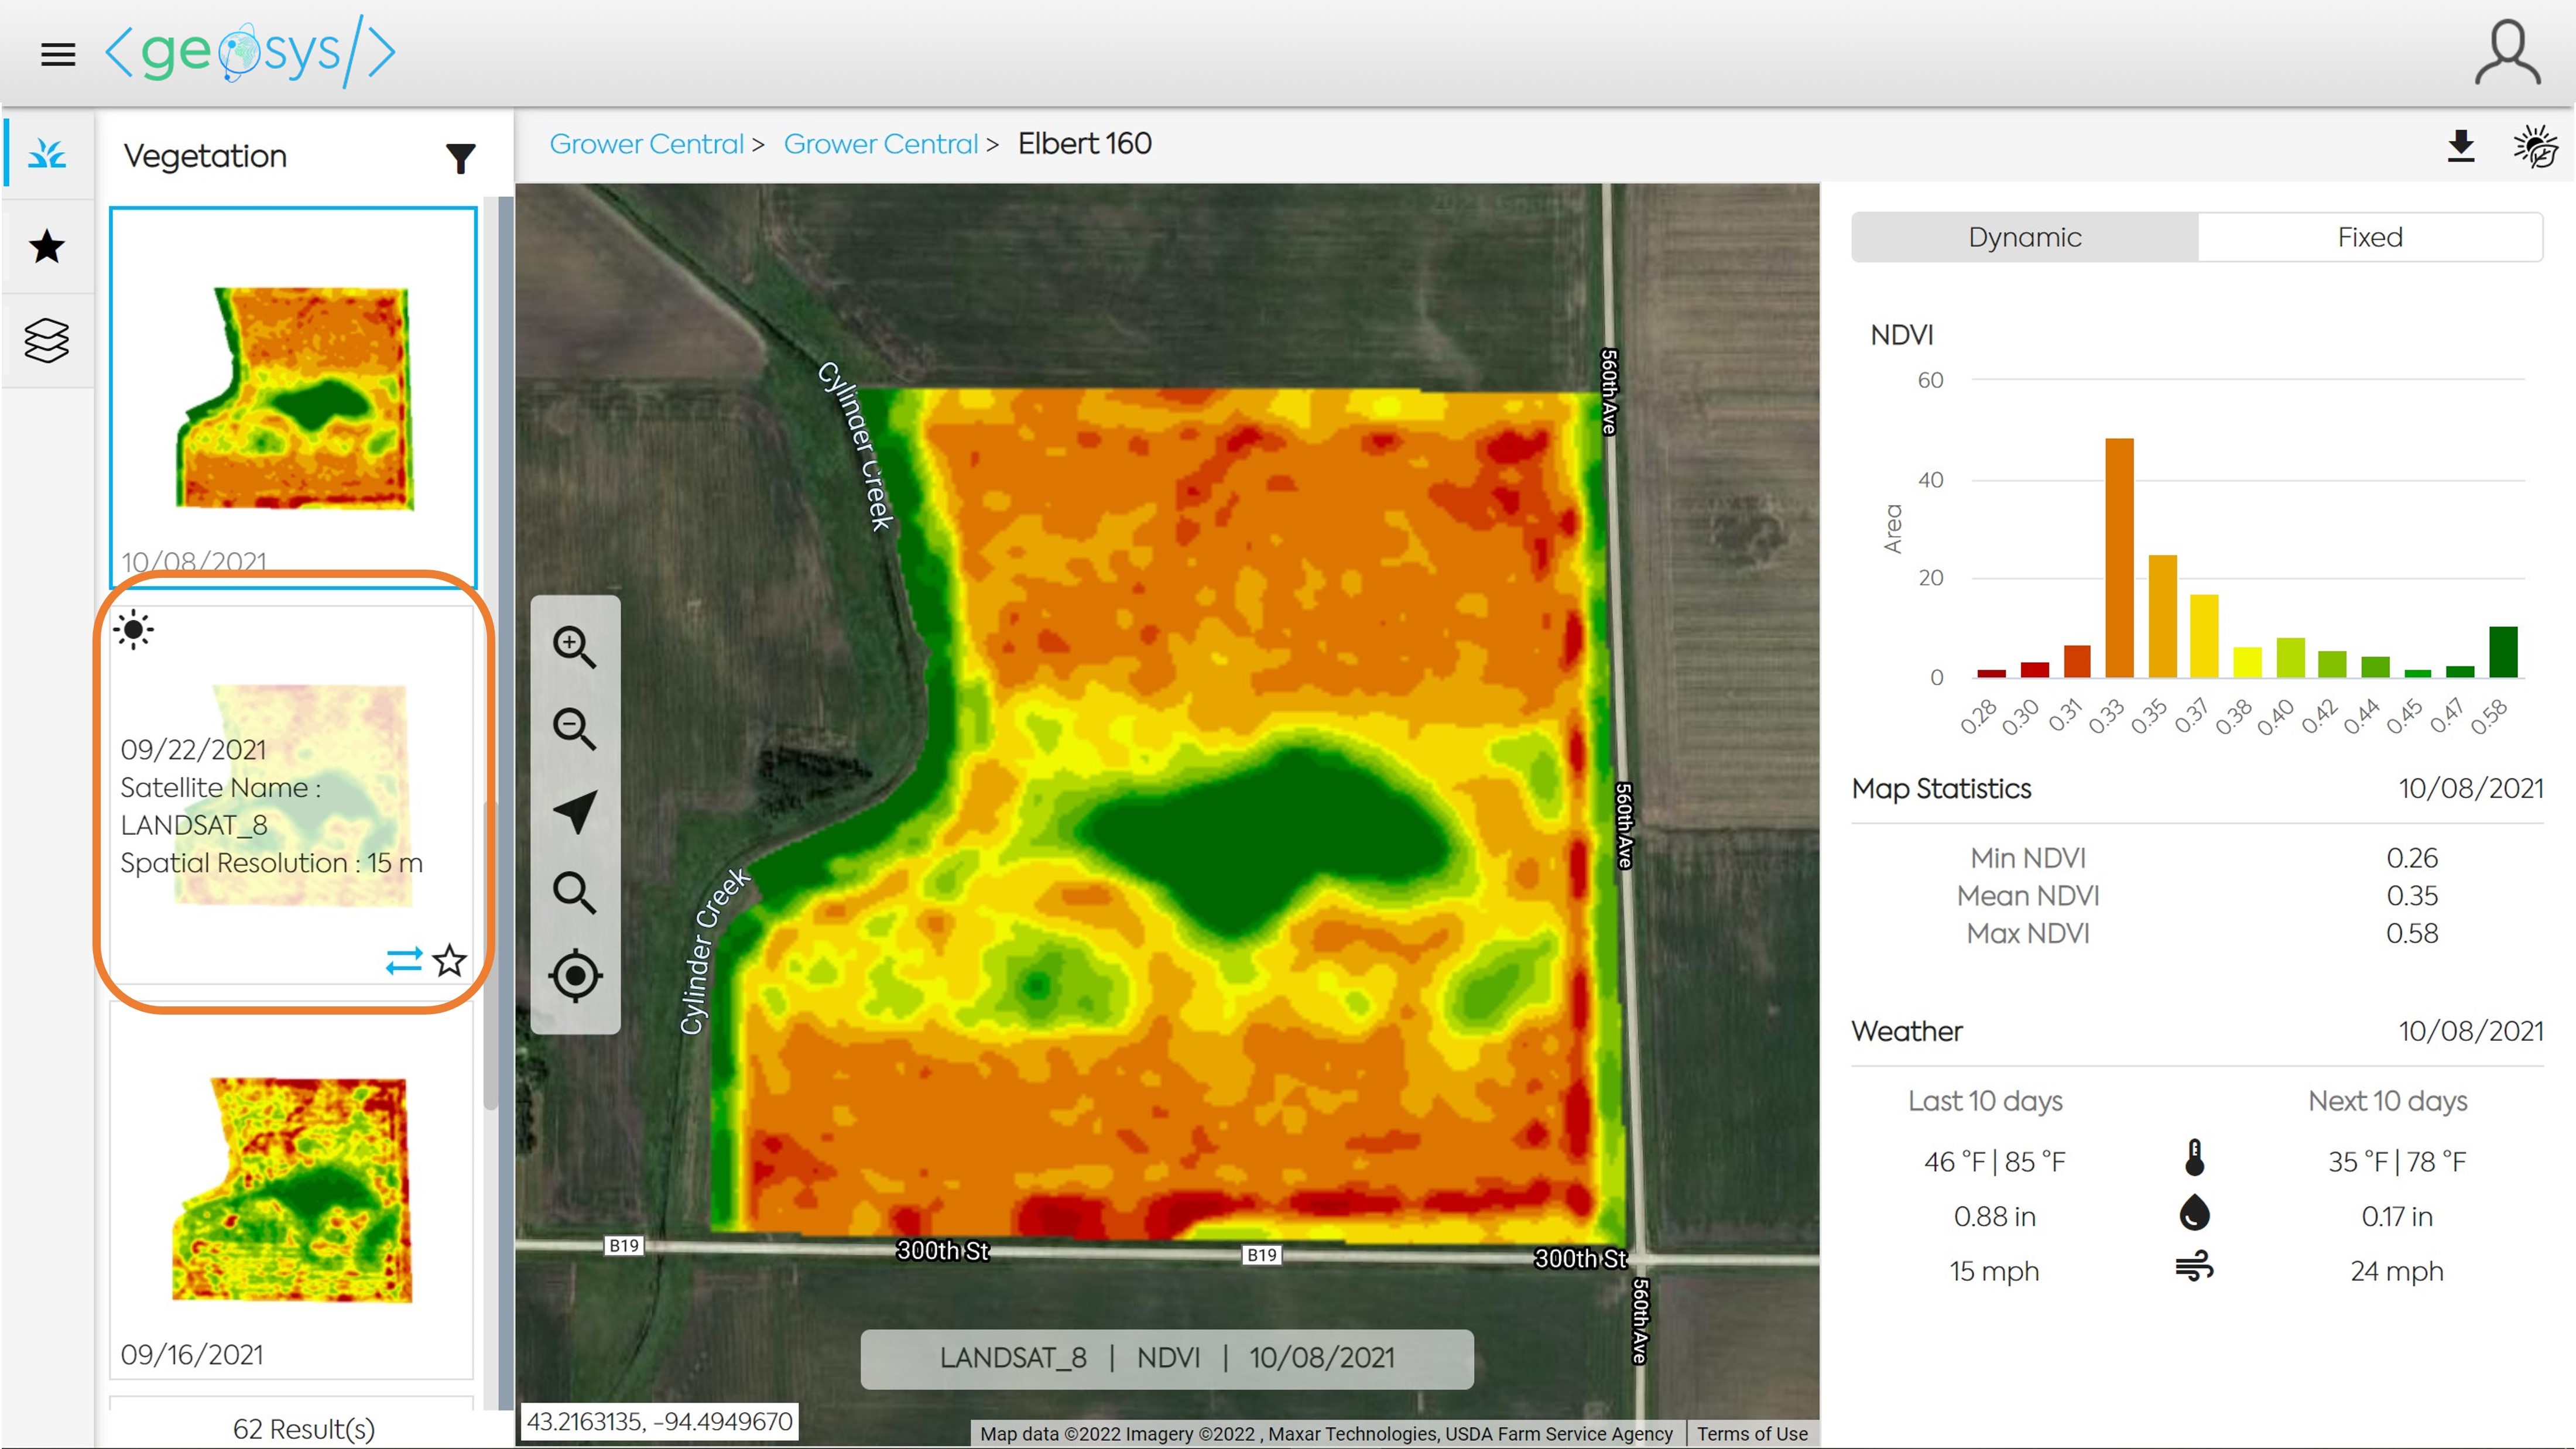
📌 Select Vegetation Map🔗
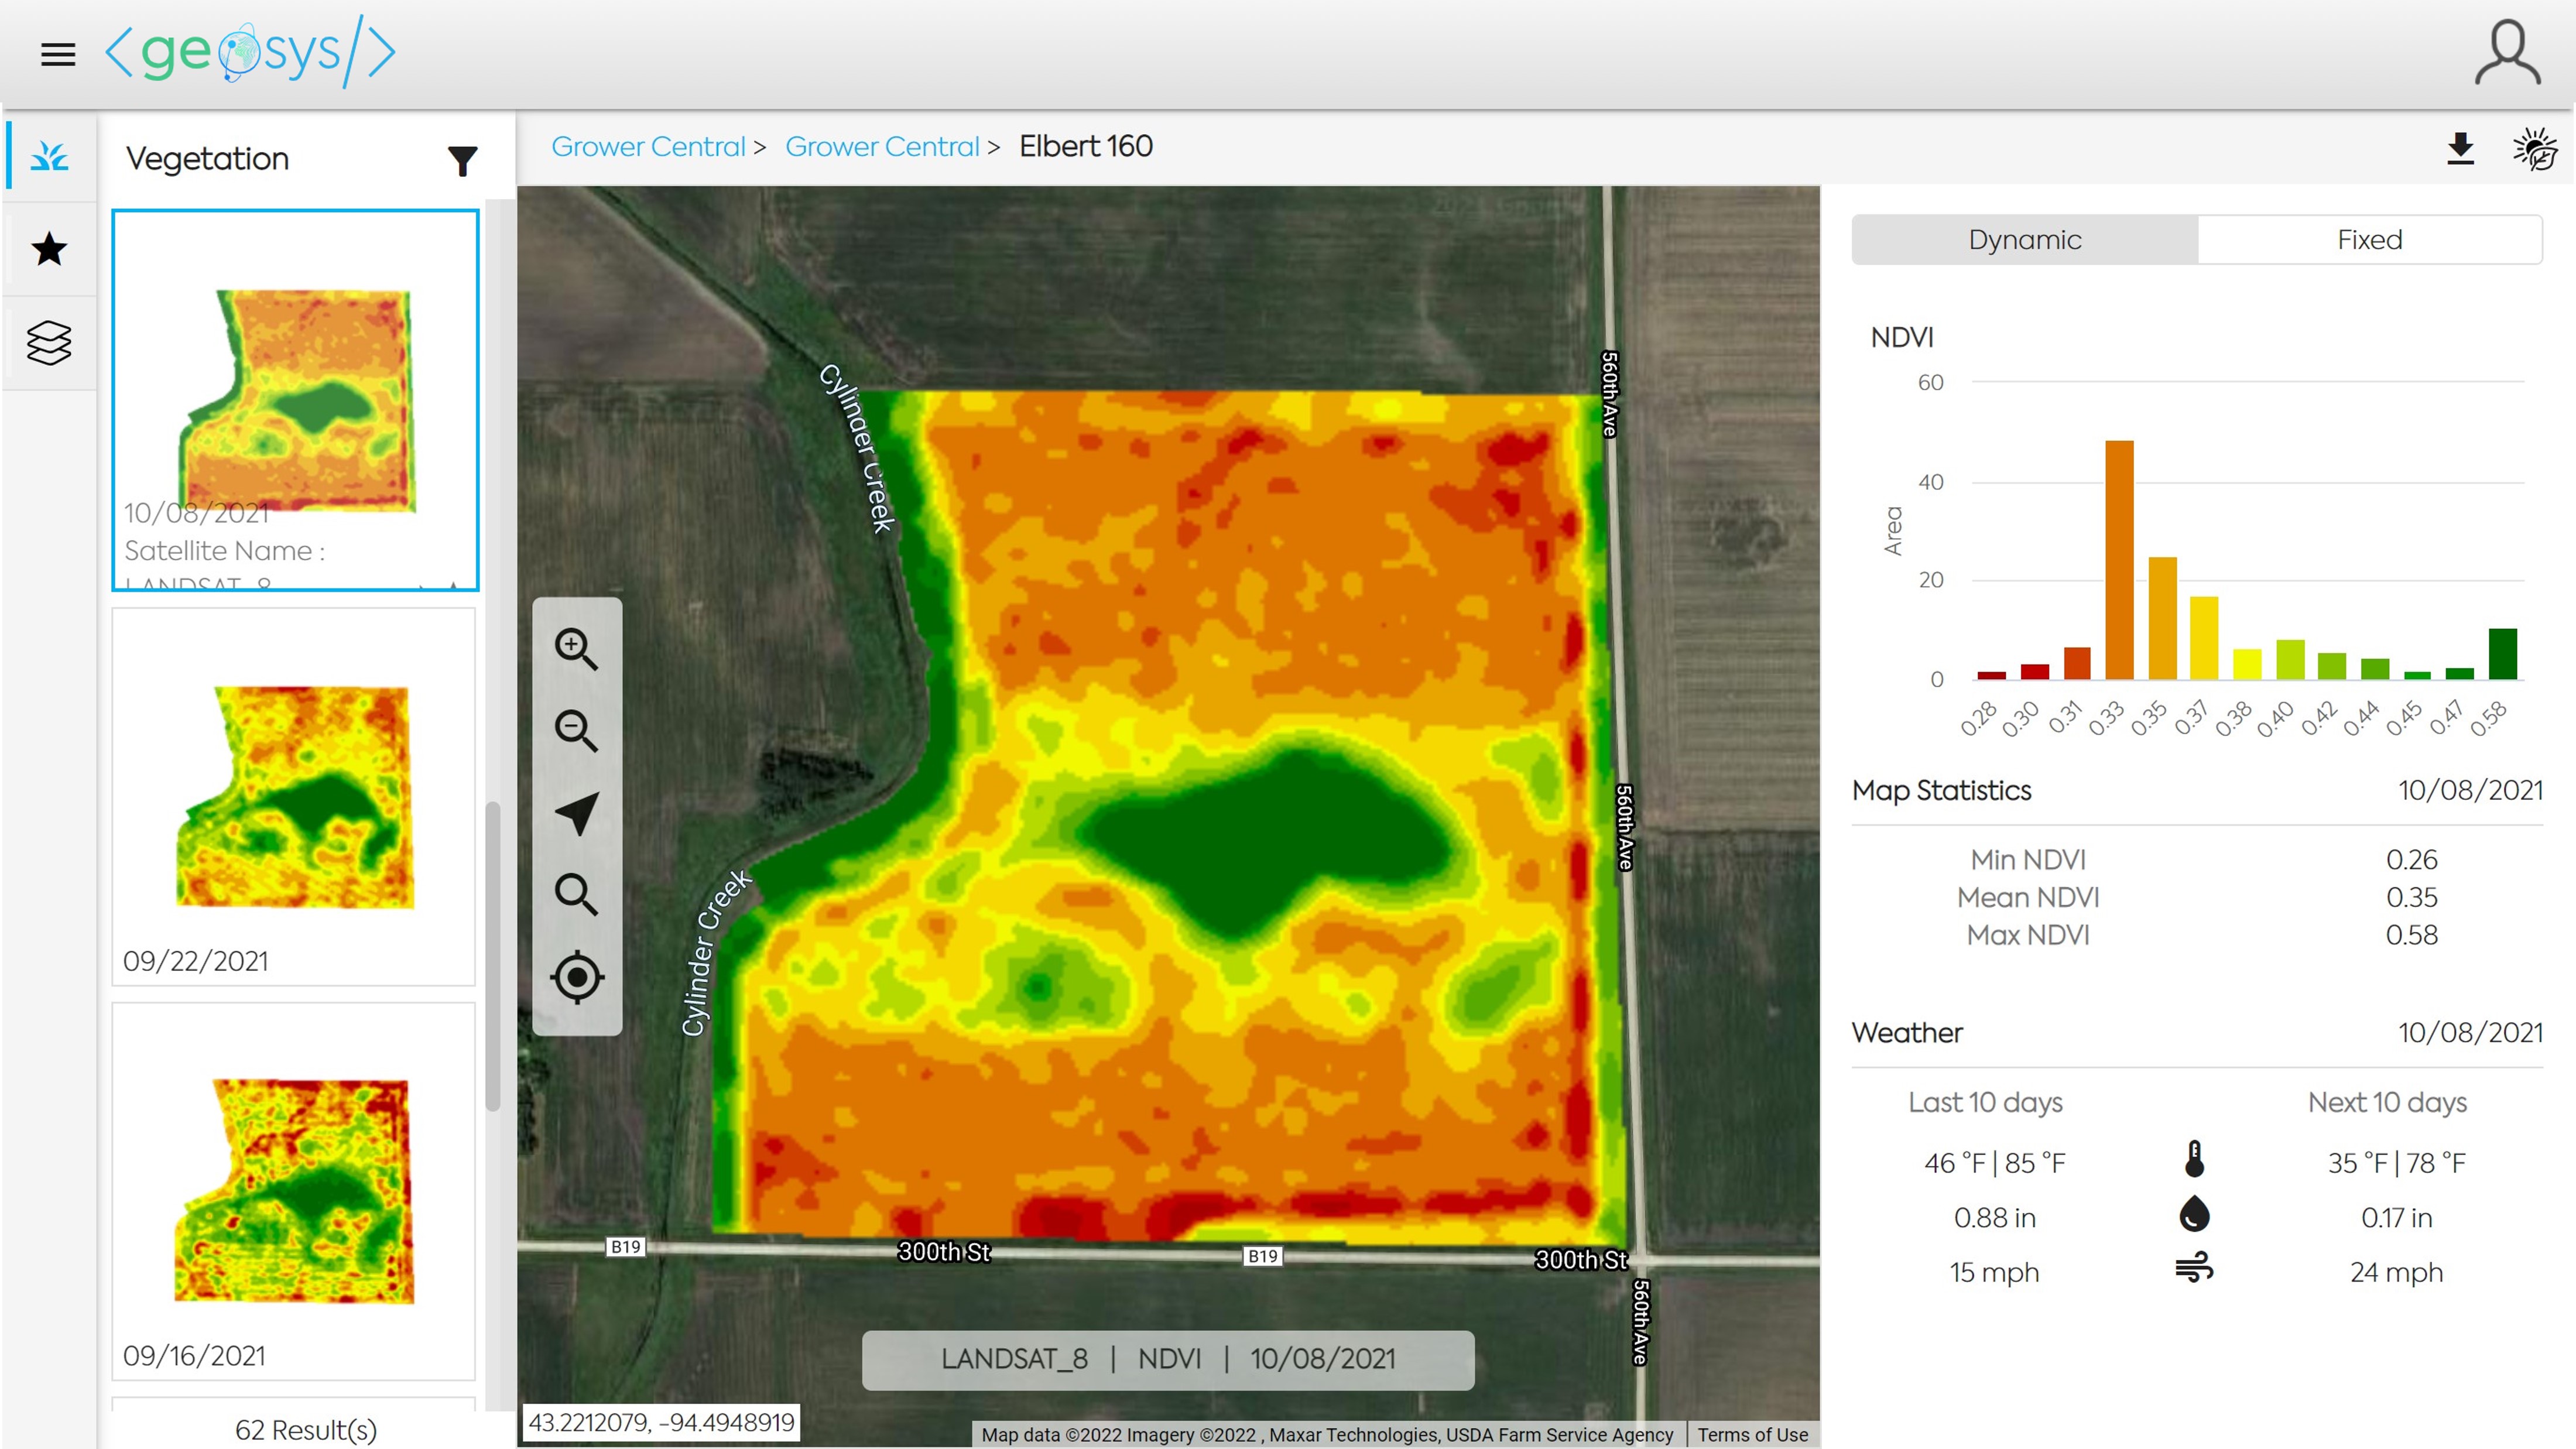
Select a Vegetation Map buy clicking on the map thumbnail in the left panel. To change the legend used for the maps you can toggle between the sensor options on the top of the right panel.
Ex 1: a Dynamic legend map where each image will have green for the highest value and red for the lowest value.
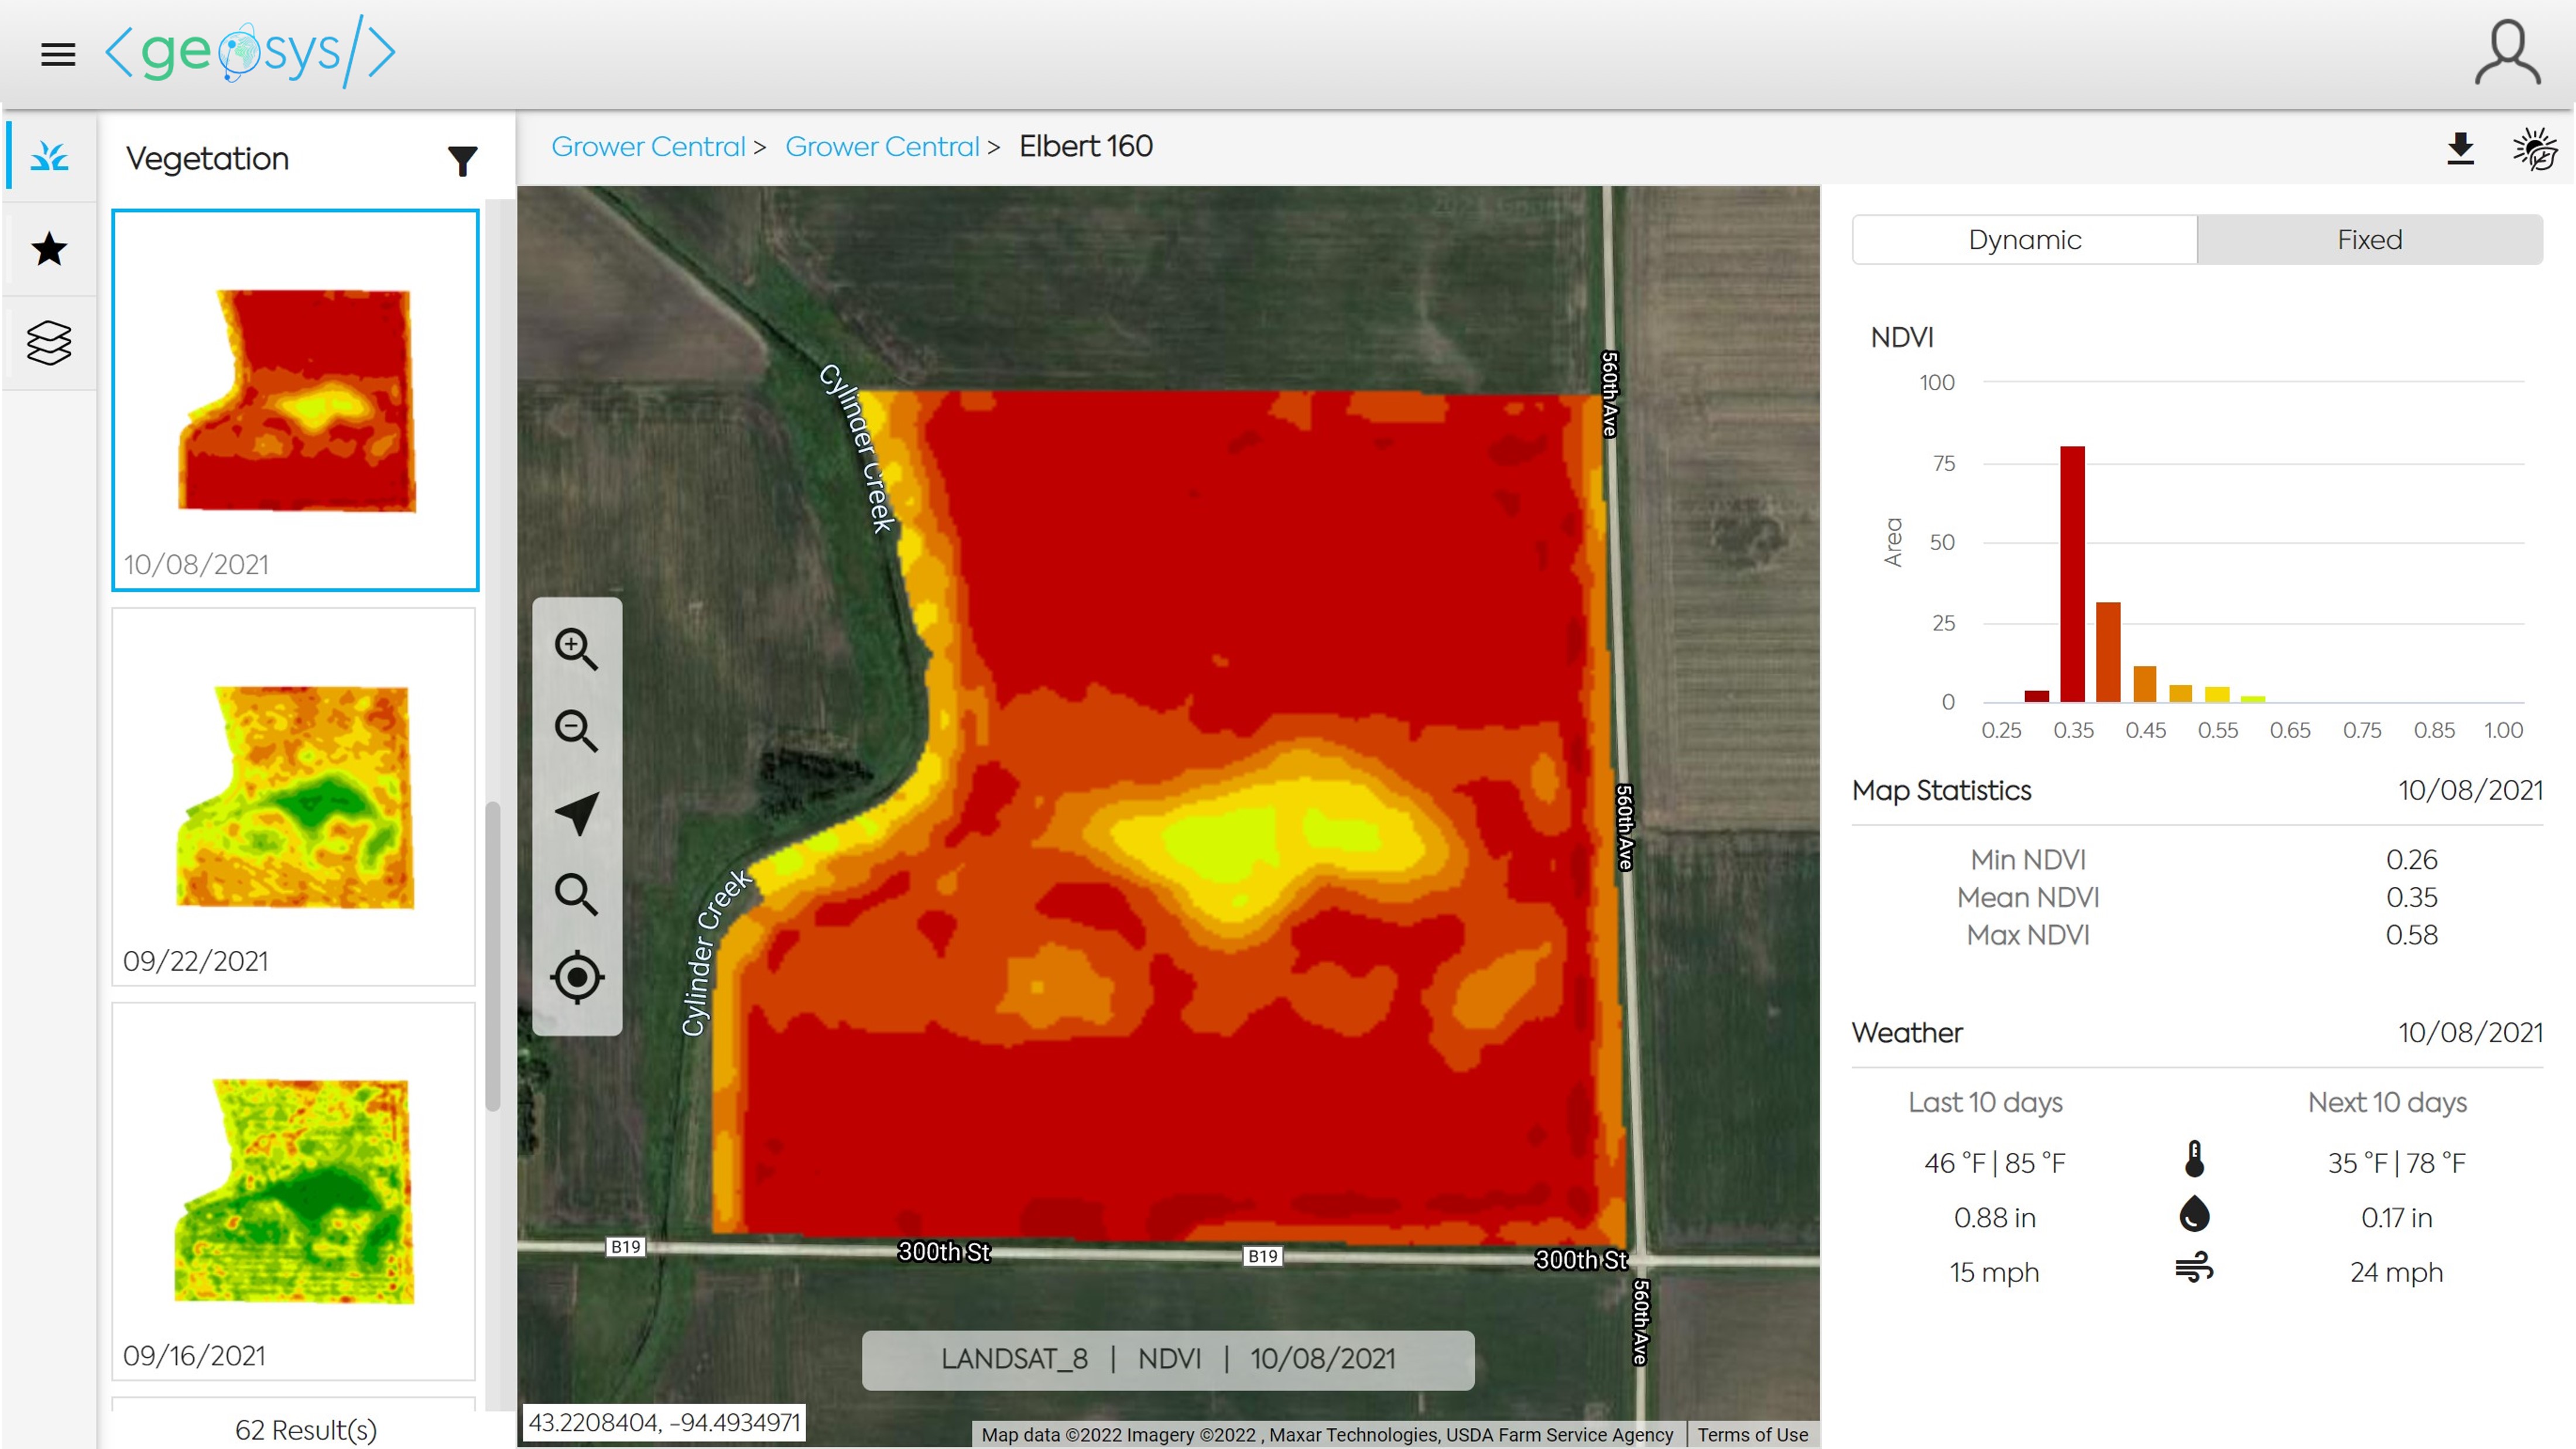
Ex 2: a Fixed legend map where each image will use the same legend based on a 0.0 to 1.0 scale.
🎯 Image Data🔗
When you hover your cursor over an image thumbnail you are able to see additional information about the image.
Clicking on the icon with two arrows will add the selected image as a second map as shown in the Map Comparison example. Clicking on the Favorite icon will add the selected image to the Favorite Map list which can be accessed by selecting the Favorite icon on the far left panel.
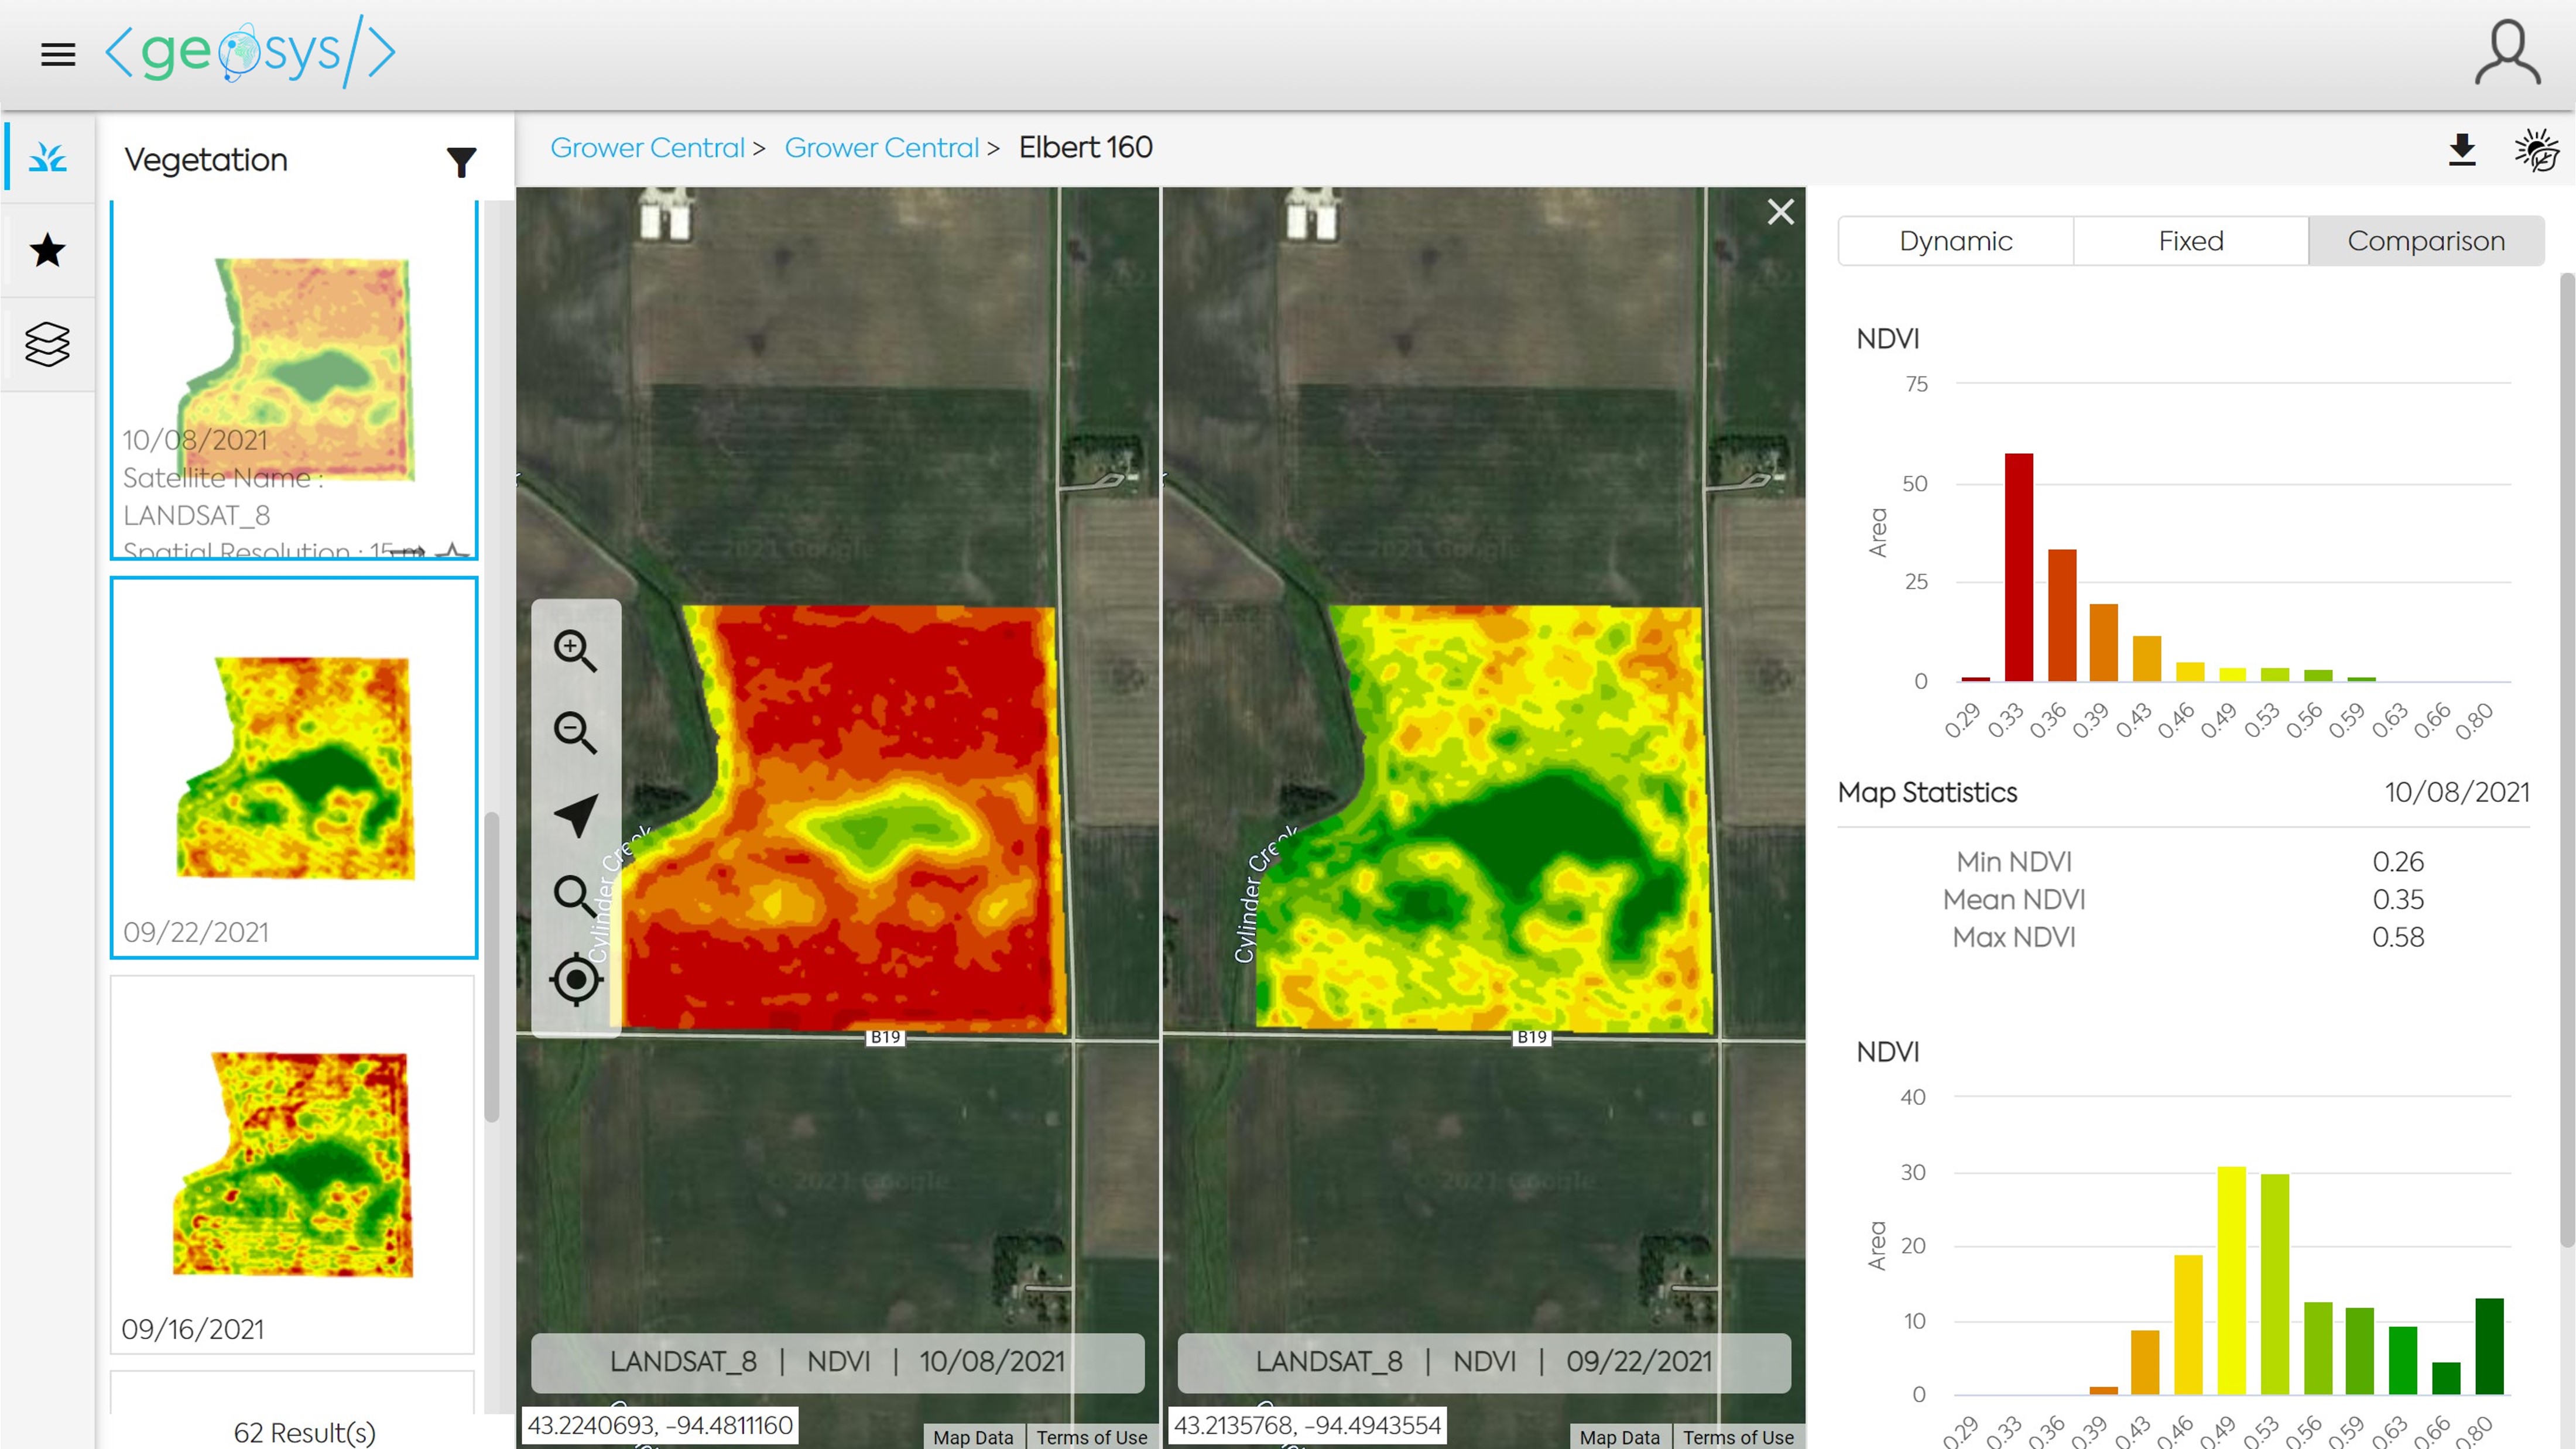
🔍 Map Comparison🔗
Clicking on the Comparison icon with two arrows in the image thumbnail will add the selected image as a second map.

When comparing two maps there is a third legend option "Comparison". The Comparison legend will have green for the highest value and red for the lowest value when looking at all pixels on both maps.
⚙️ Simple Zoning🔗
You can easily highlight zones on your map by clicking directly on the legend. The corresponding area is highlighted on the map. Multiple legend ranges can be selected at the same time.

You can also decide to display a specific number of zones on your map using the zoning option at the bottom right of your screen.

The generated zones can be downloaded. Click on the download button in the top bar when the zones are displayed.

🌾 Management Zones🔗
For more advanced zoning capabilities, you can use our zone management option. This zoning involves selecting several image dates and choosing the number of zones desired in the output map. Then all of the selected image's data will be analyzed to associate the pixels closest to each other based on performance.
To do this, select the images of interest directly in the carousel. A "+" button is available, allowing you to add your images to the cart (visible in the top bar).

Once your selection is complete, go to the cart and click on "create a zoning map." A new page will open for you to configure your map. You will need to give it a name a to select the number of zones desired.

Your management zone map has now been created. You can retrieve it at any time by accessing the management section in the left-hand menu.

🚜 Rx Maps (Variable Rate Application)🔗
In precision agriculture, variable rate application refers to the application of a product such that the rate of application is based on the precise location, or qualities of the zone or area that the product is being applied to. In the Map Analysis module you can create and export Rx Maps based on any imagery products you have available, such as management zones maps, or simple zoning maps based on vegetation, soil, or elevation.
