Monitoring - Regional🔗
🔍 Entity Selection🔗
When viewing the Monitoring Module you will first select the entity(ies) you would like to view.
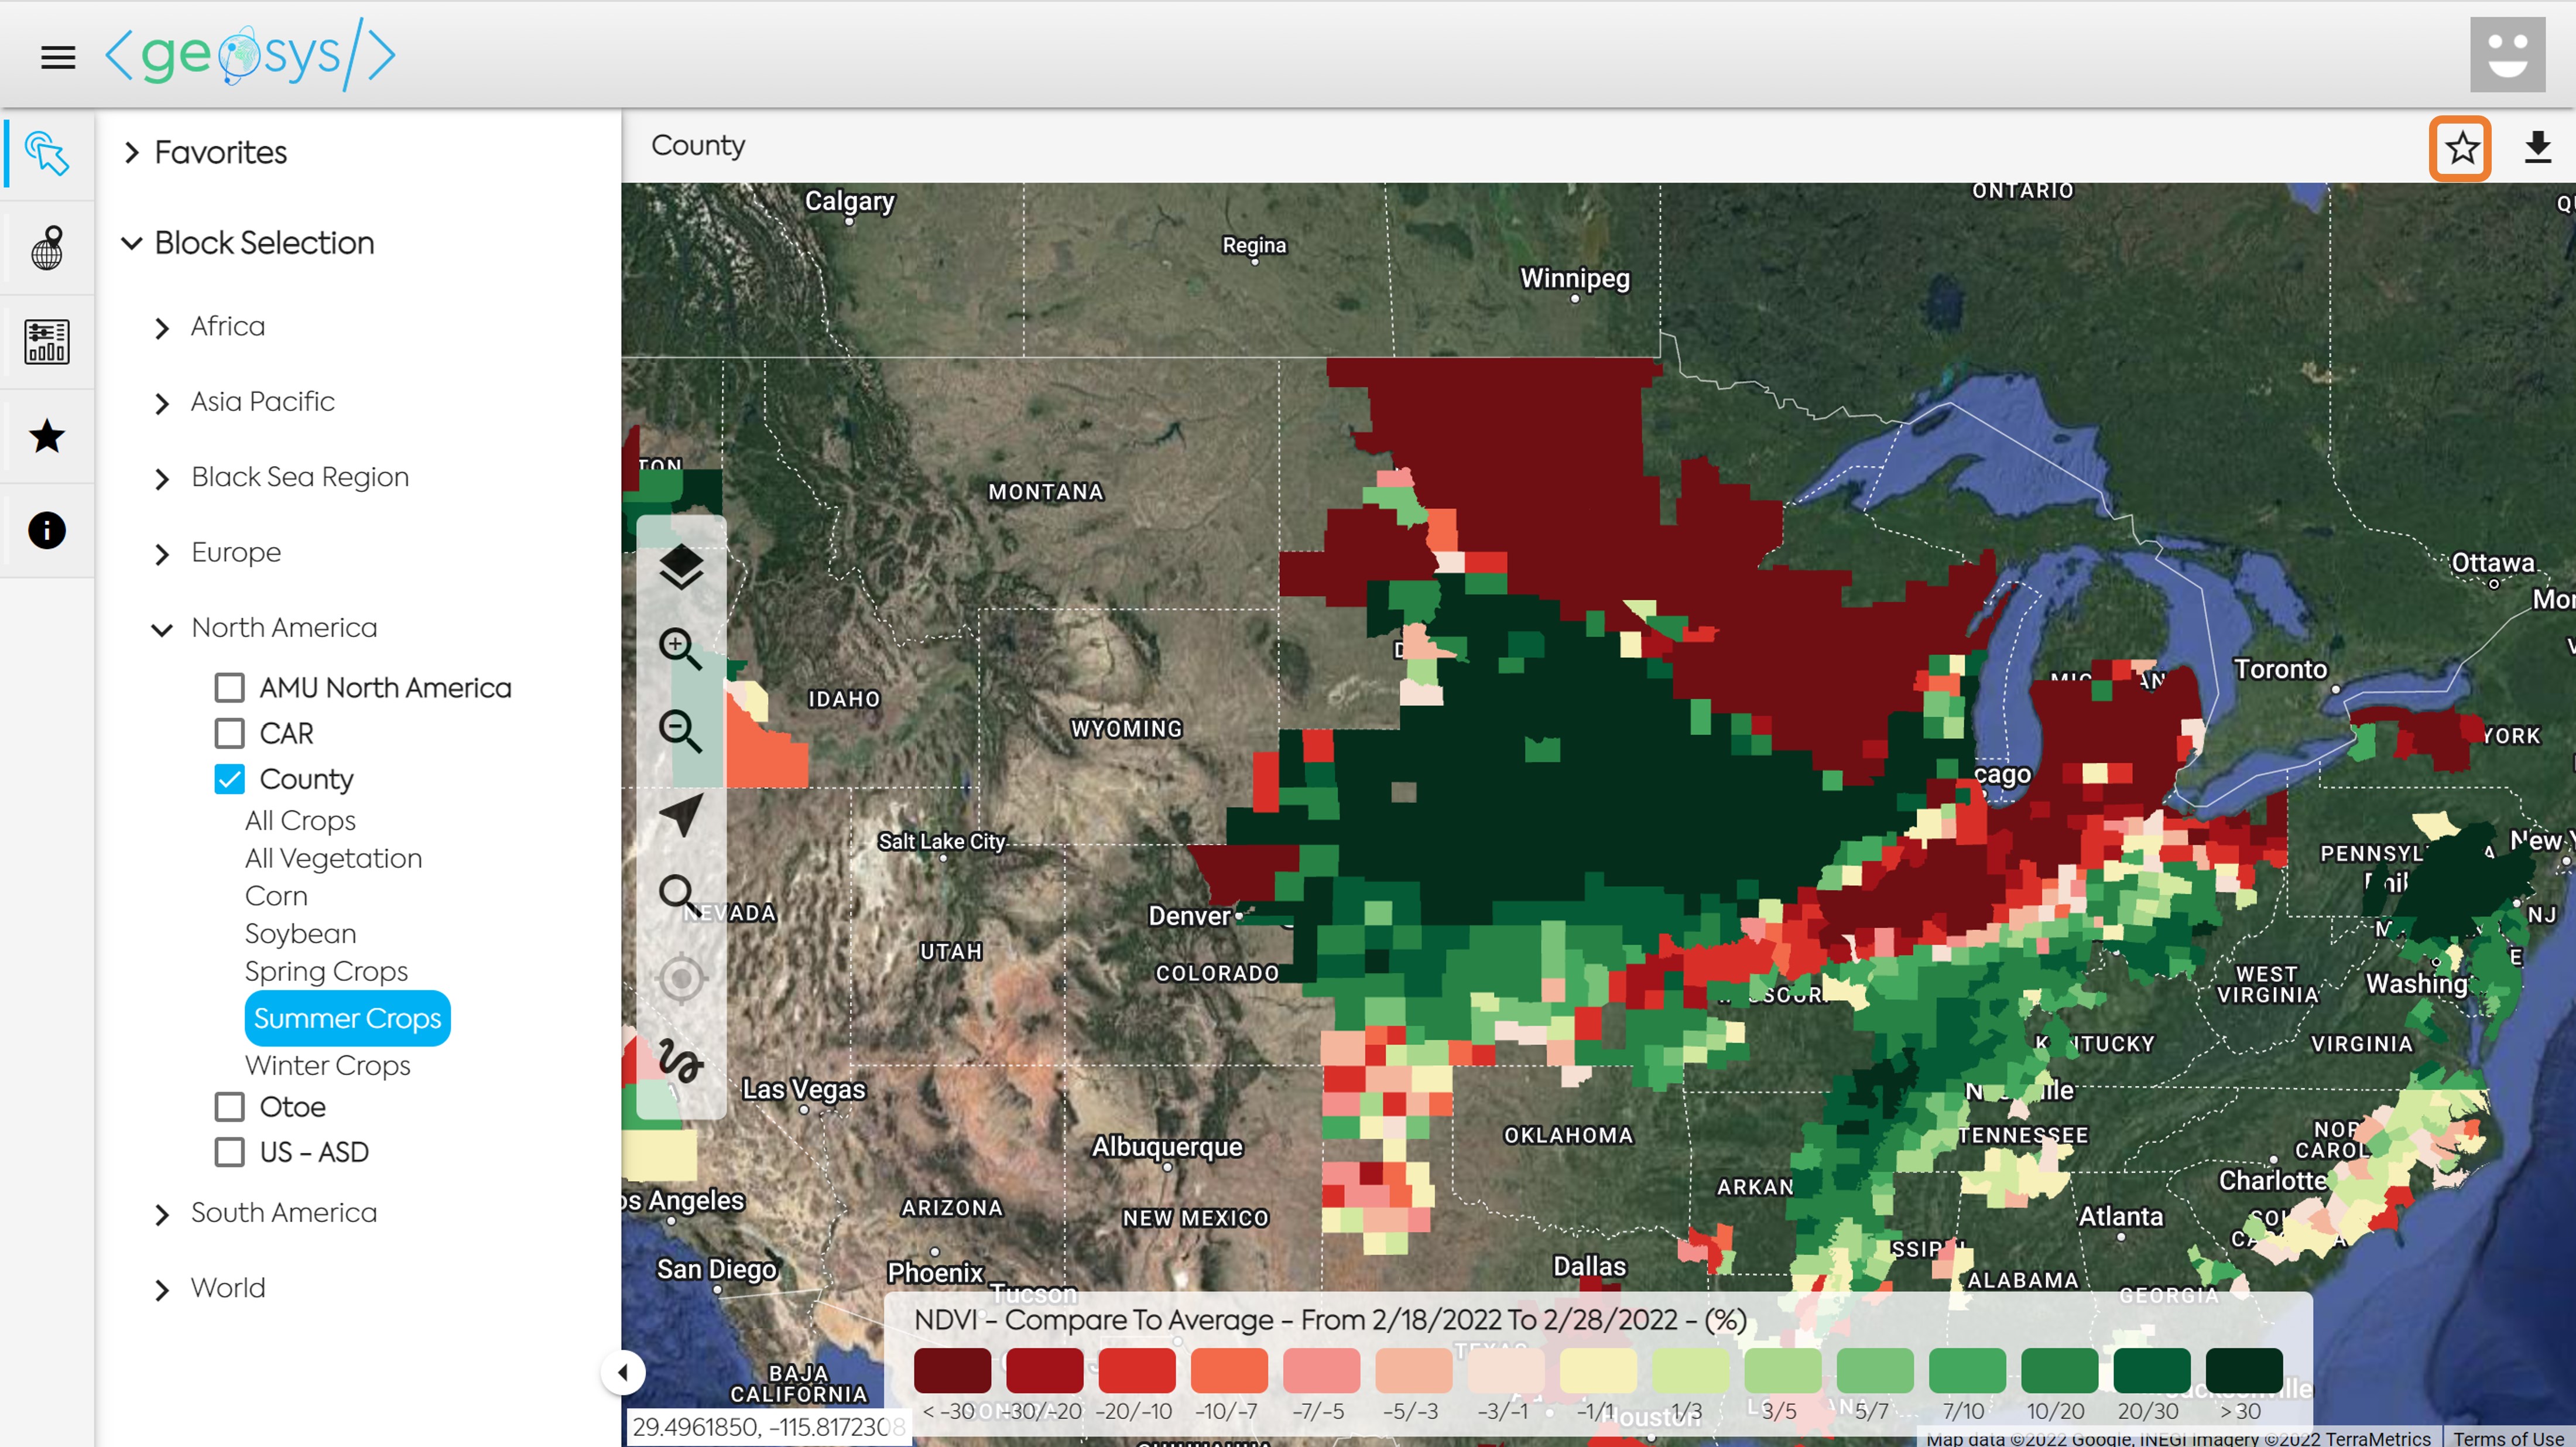
In Regional Monitoring, you will need to open either the Favorites or Block Selection to choose your entity(ies).
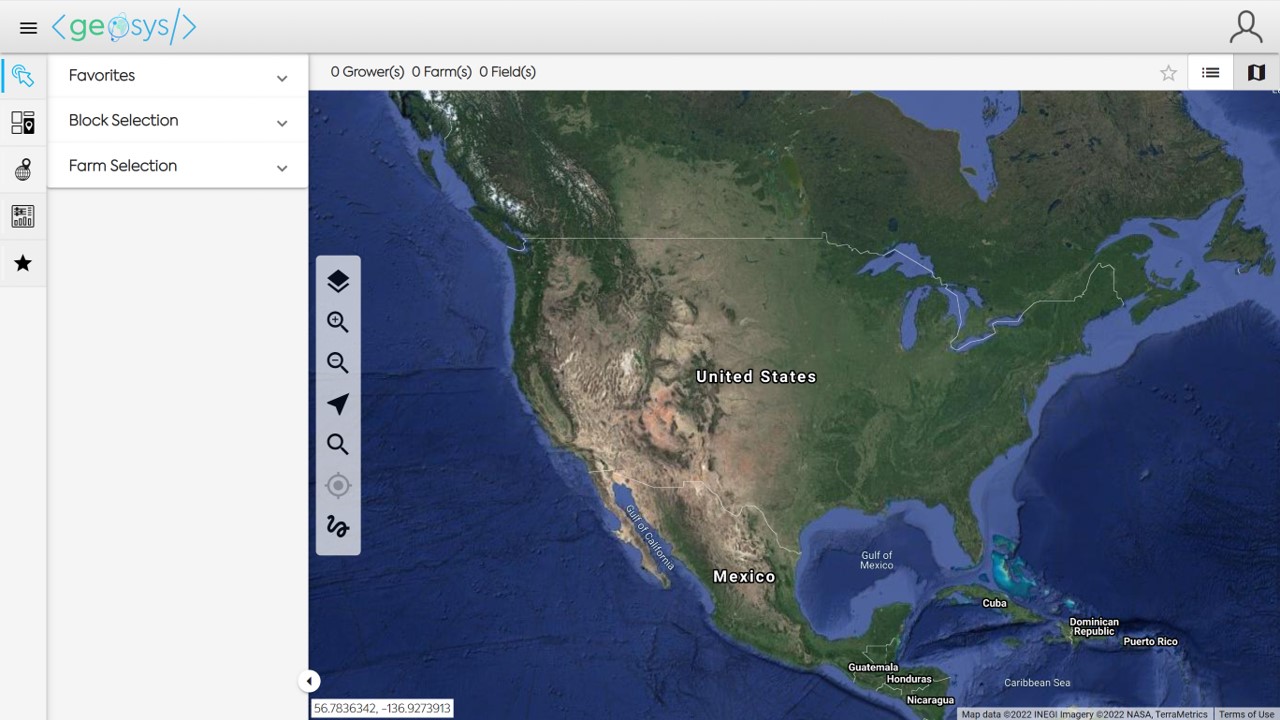
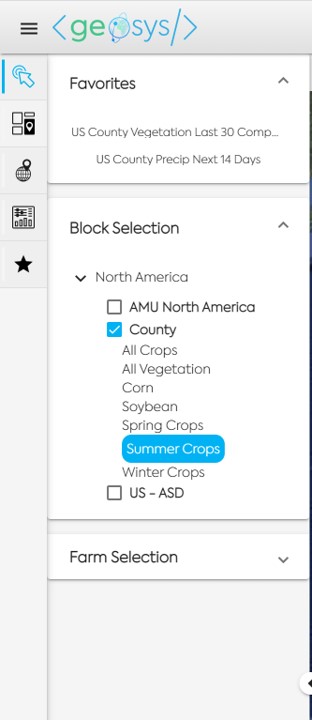
Block Selection will show all the aggregation levels (Blocks) you have available in your subscription.
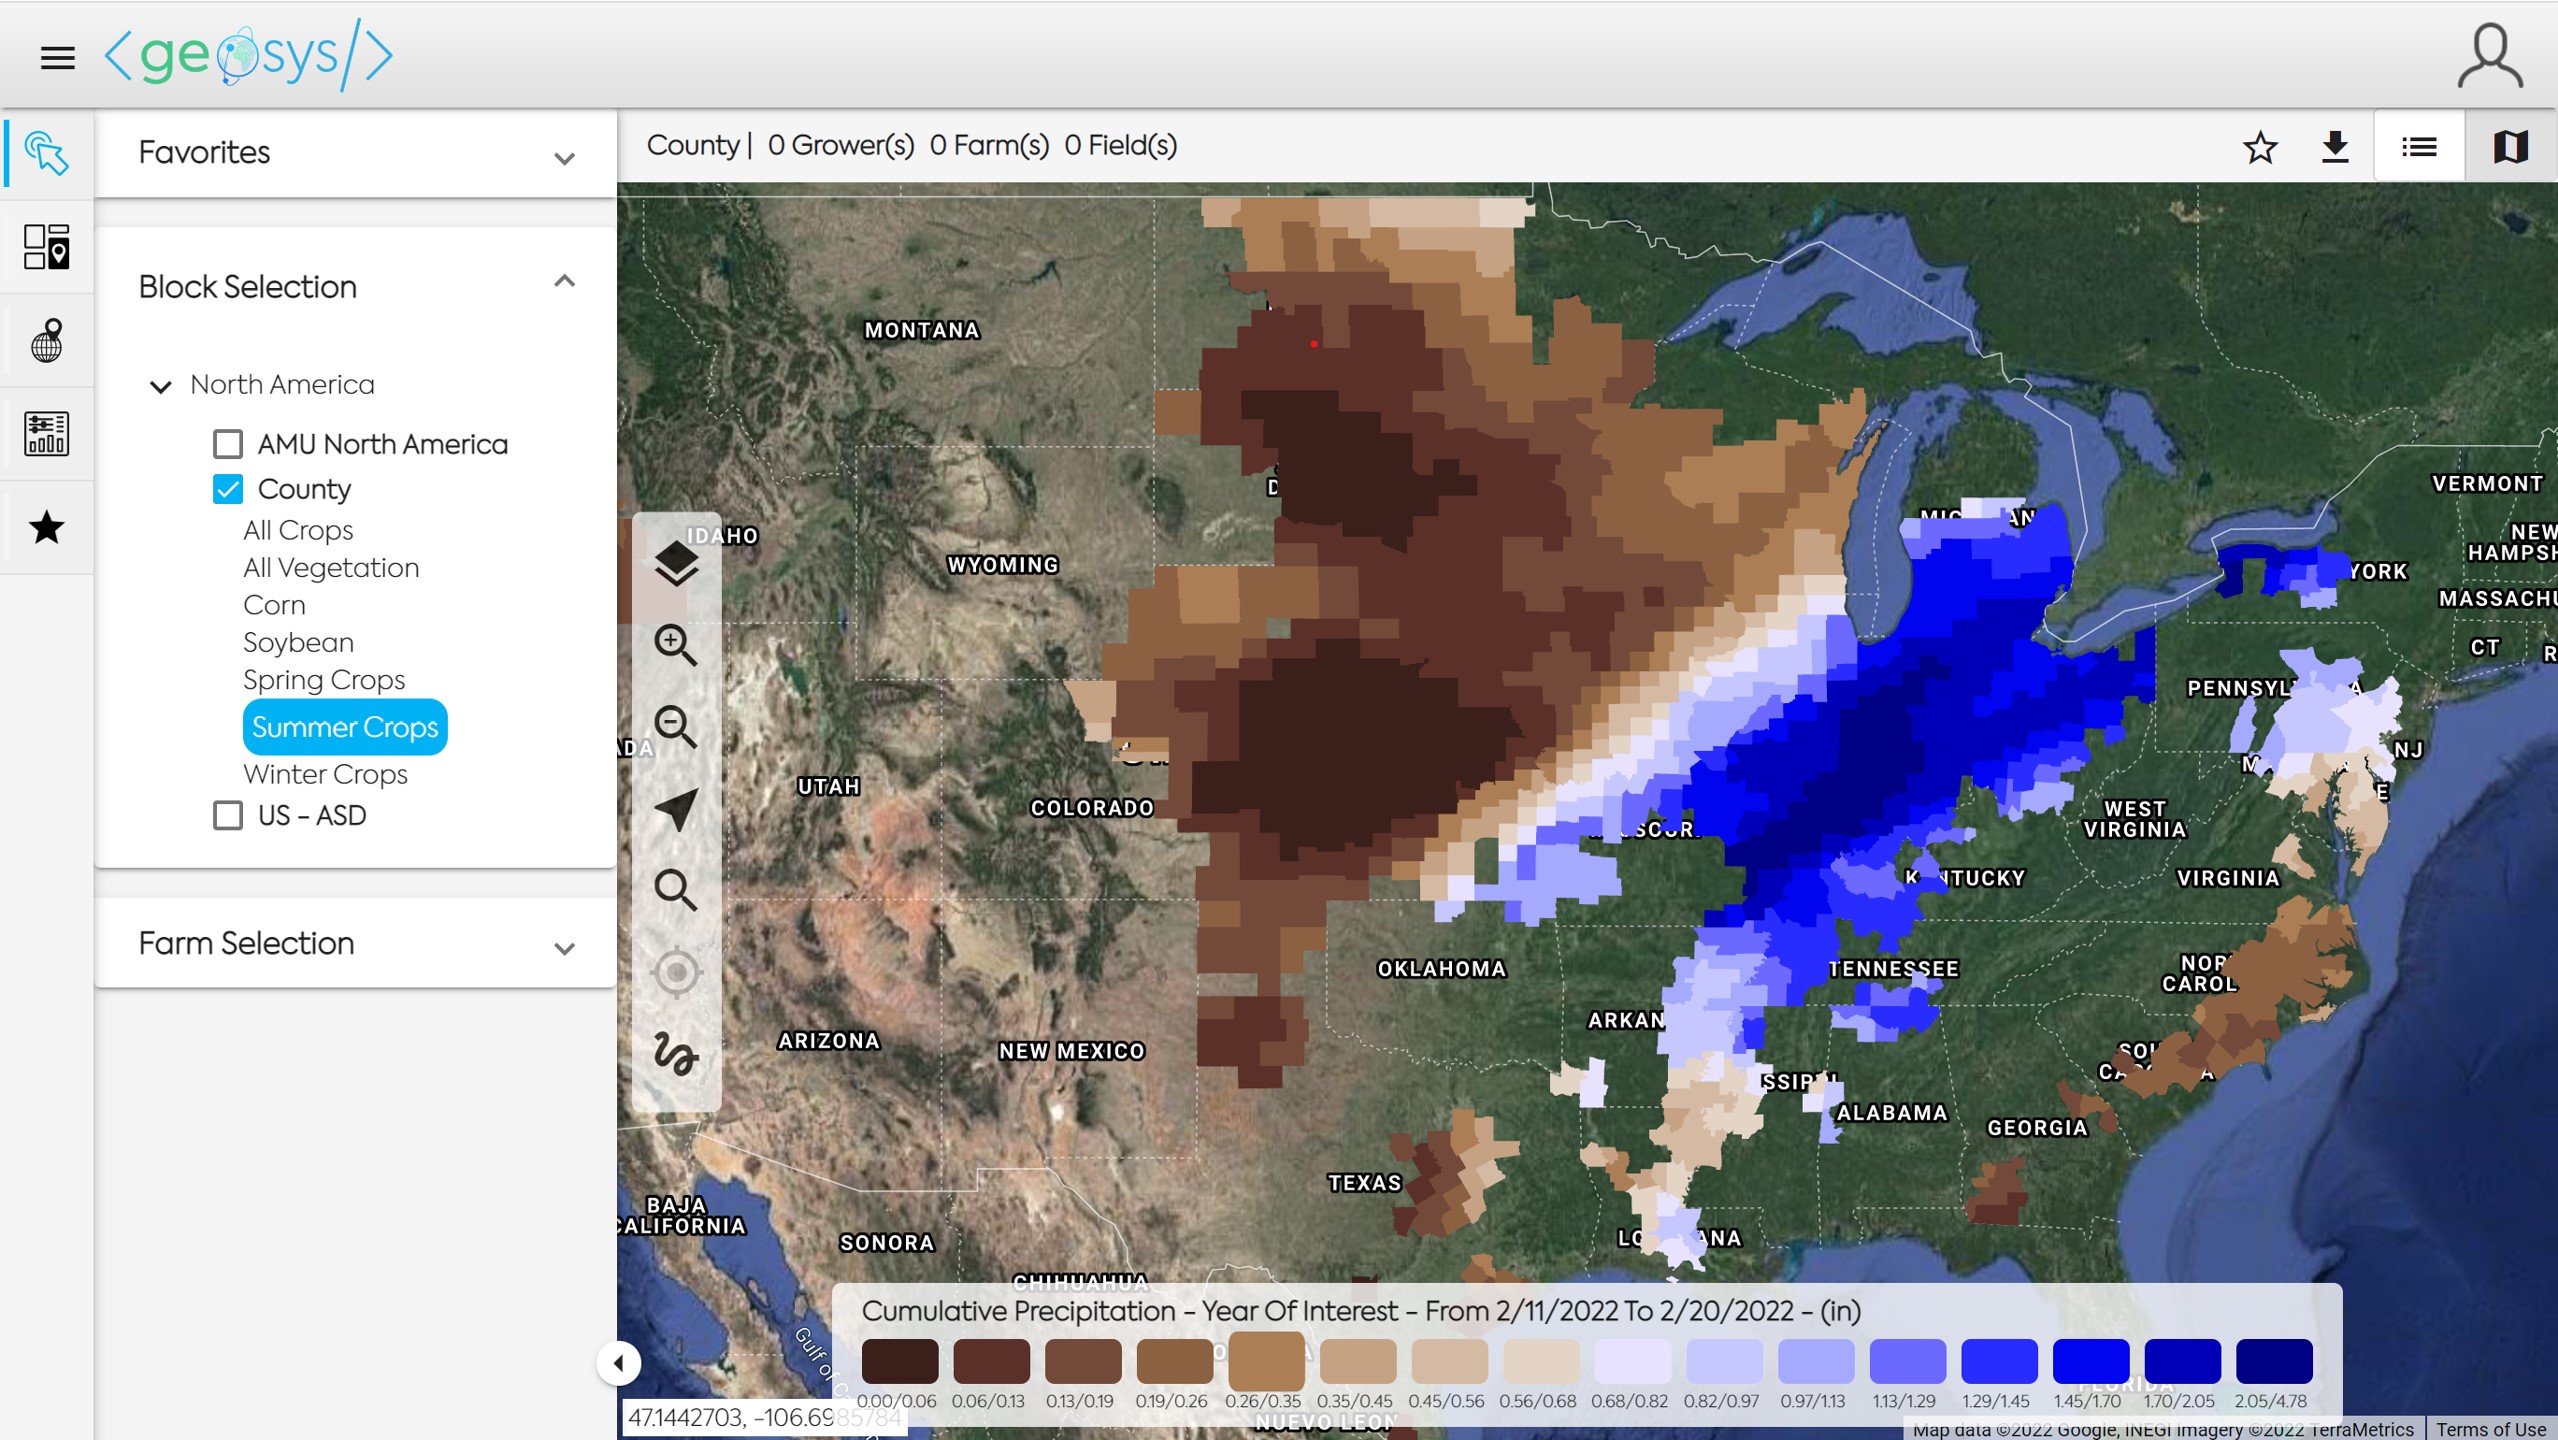
Select one and then choose the Crop Mask you would like to apply to the map.
After the block selection the default analytic will be displayed.
Select Regional Analytic🔗
Regional analytics categories include:
- Vegetation
- Rainfall
- Temperature
- Wind
- Solar Radiation
Follow the five steps in the "Select an Analytic" menu and click OK to load the map.
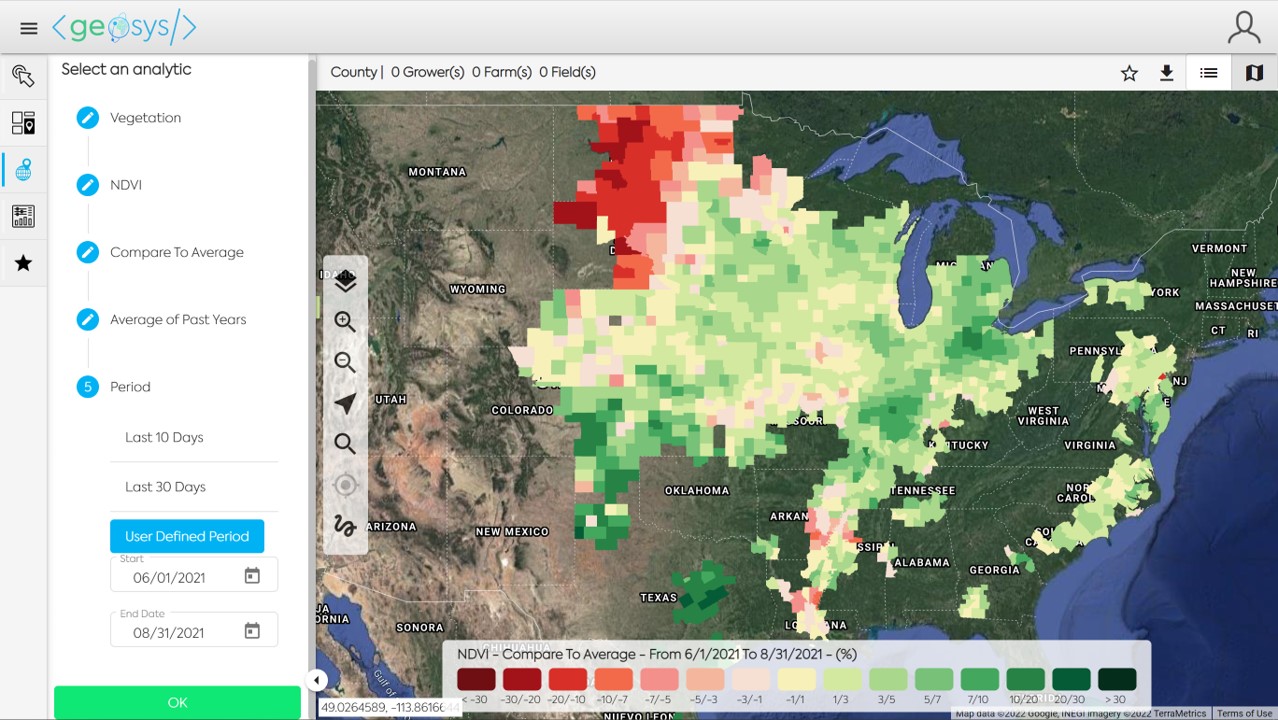
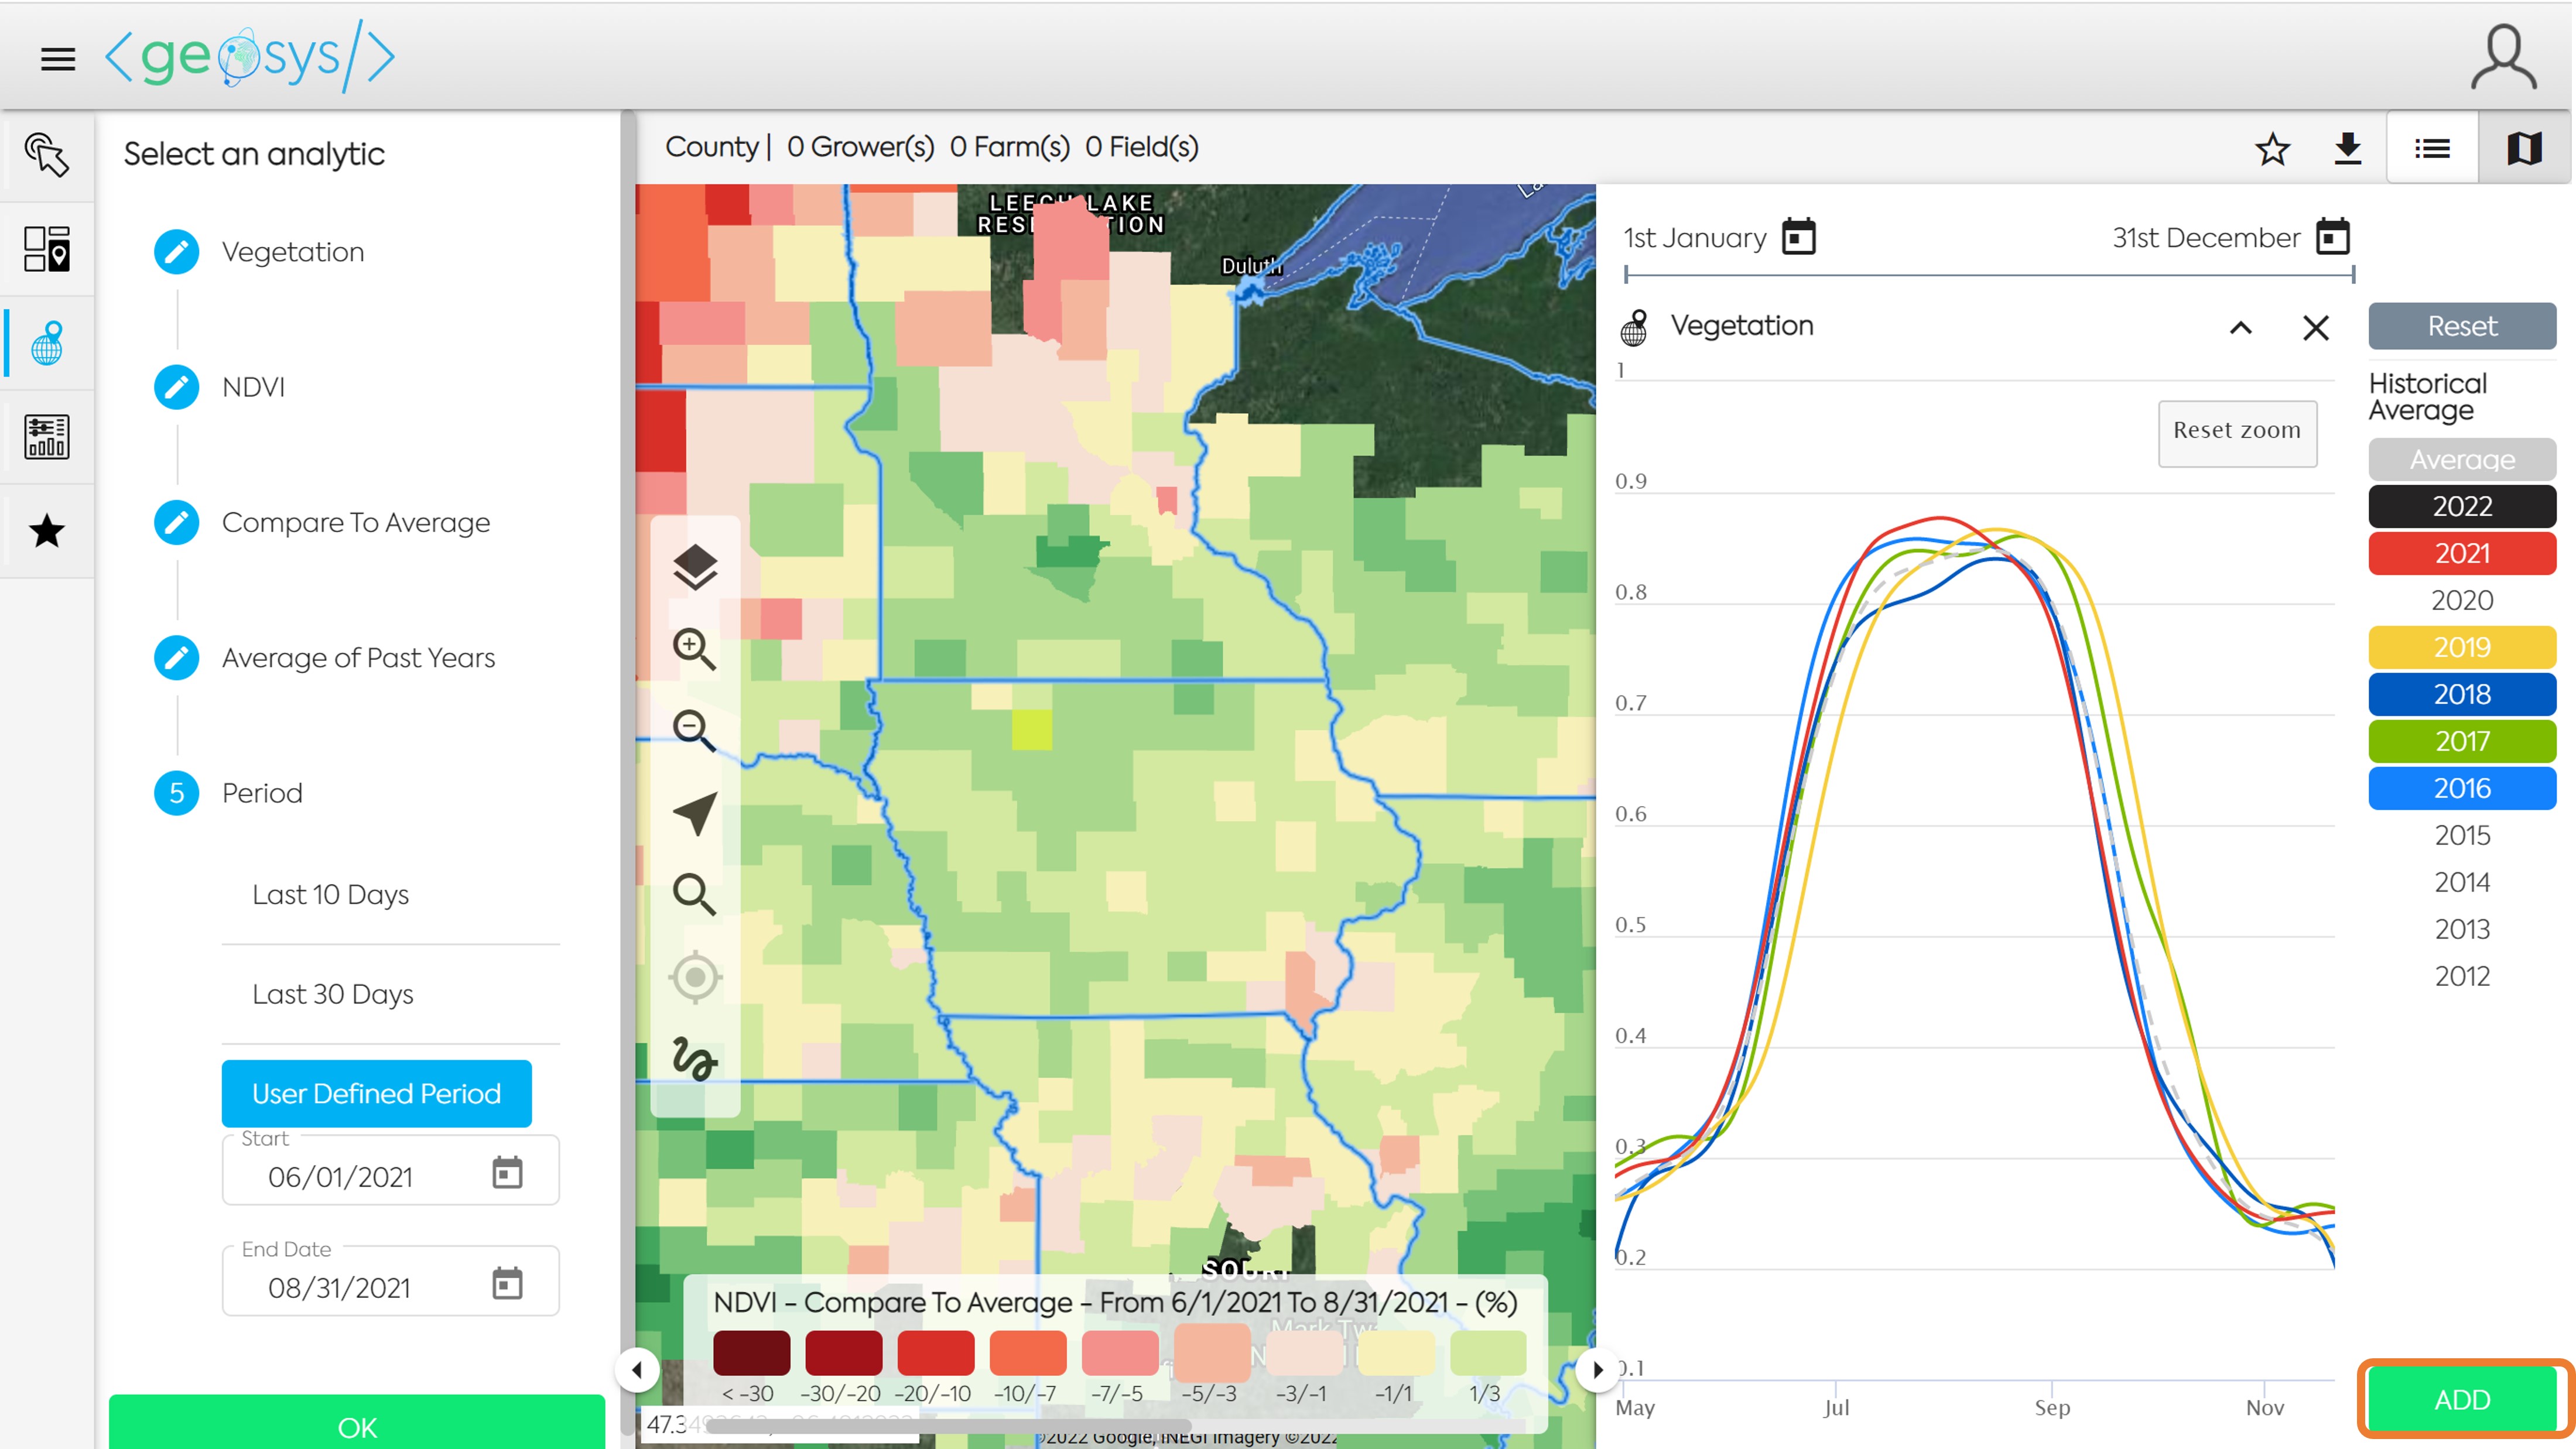
📈 Time Series Viewer🔗
Click on one or more entities and it will open the Time Series Viewer panel. You may select one entity by clicking on it, or multiple entities by using the lasso in the map navigation menu (freeform line tool at the bottom). Click on the Years on the right side of the panel to add more curves. The color of the year selected will correspond to the color of the curve. Click on the date calendars at the top of the panel to adjust the Start and End Dates of the Time Series.

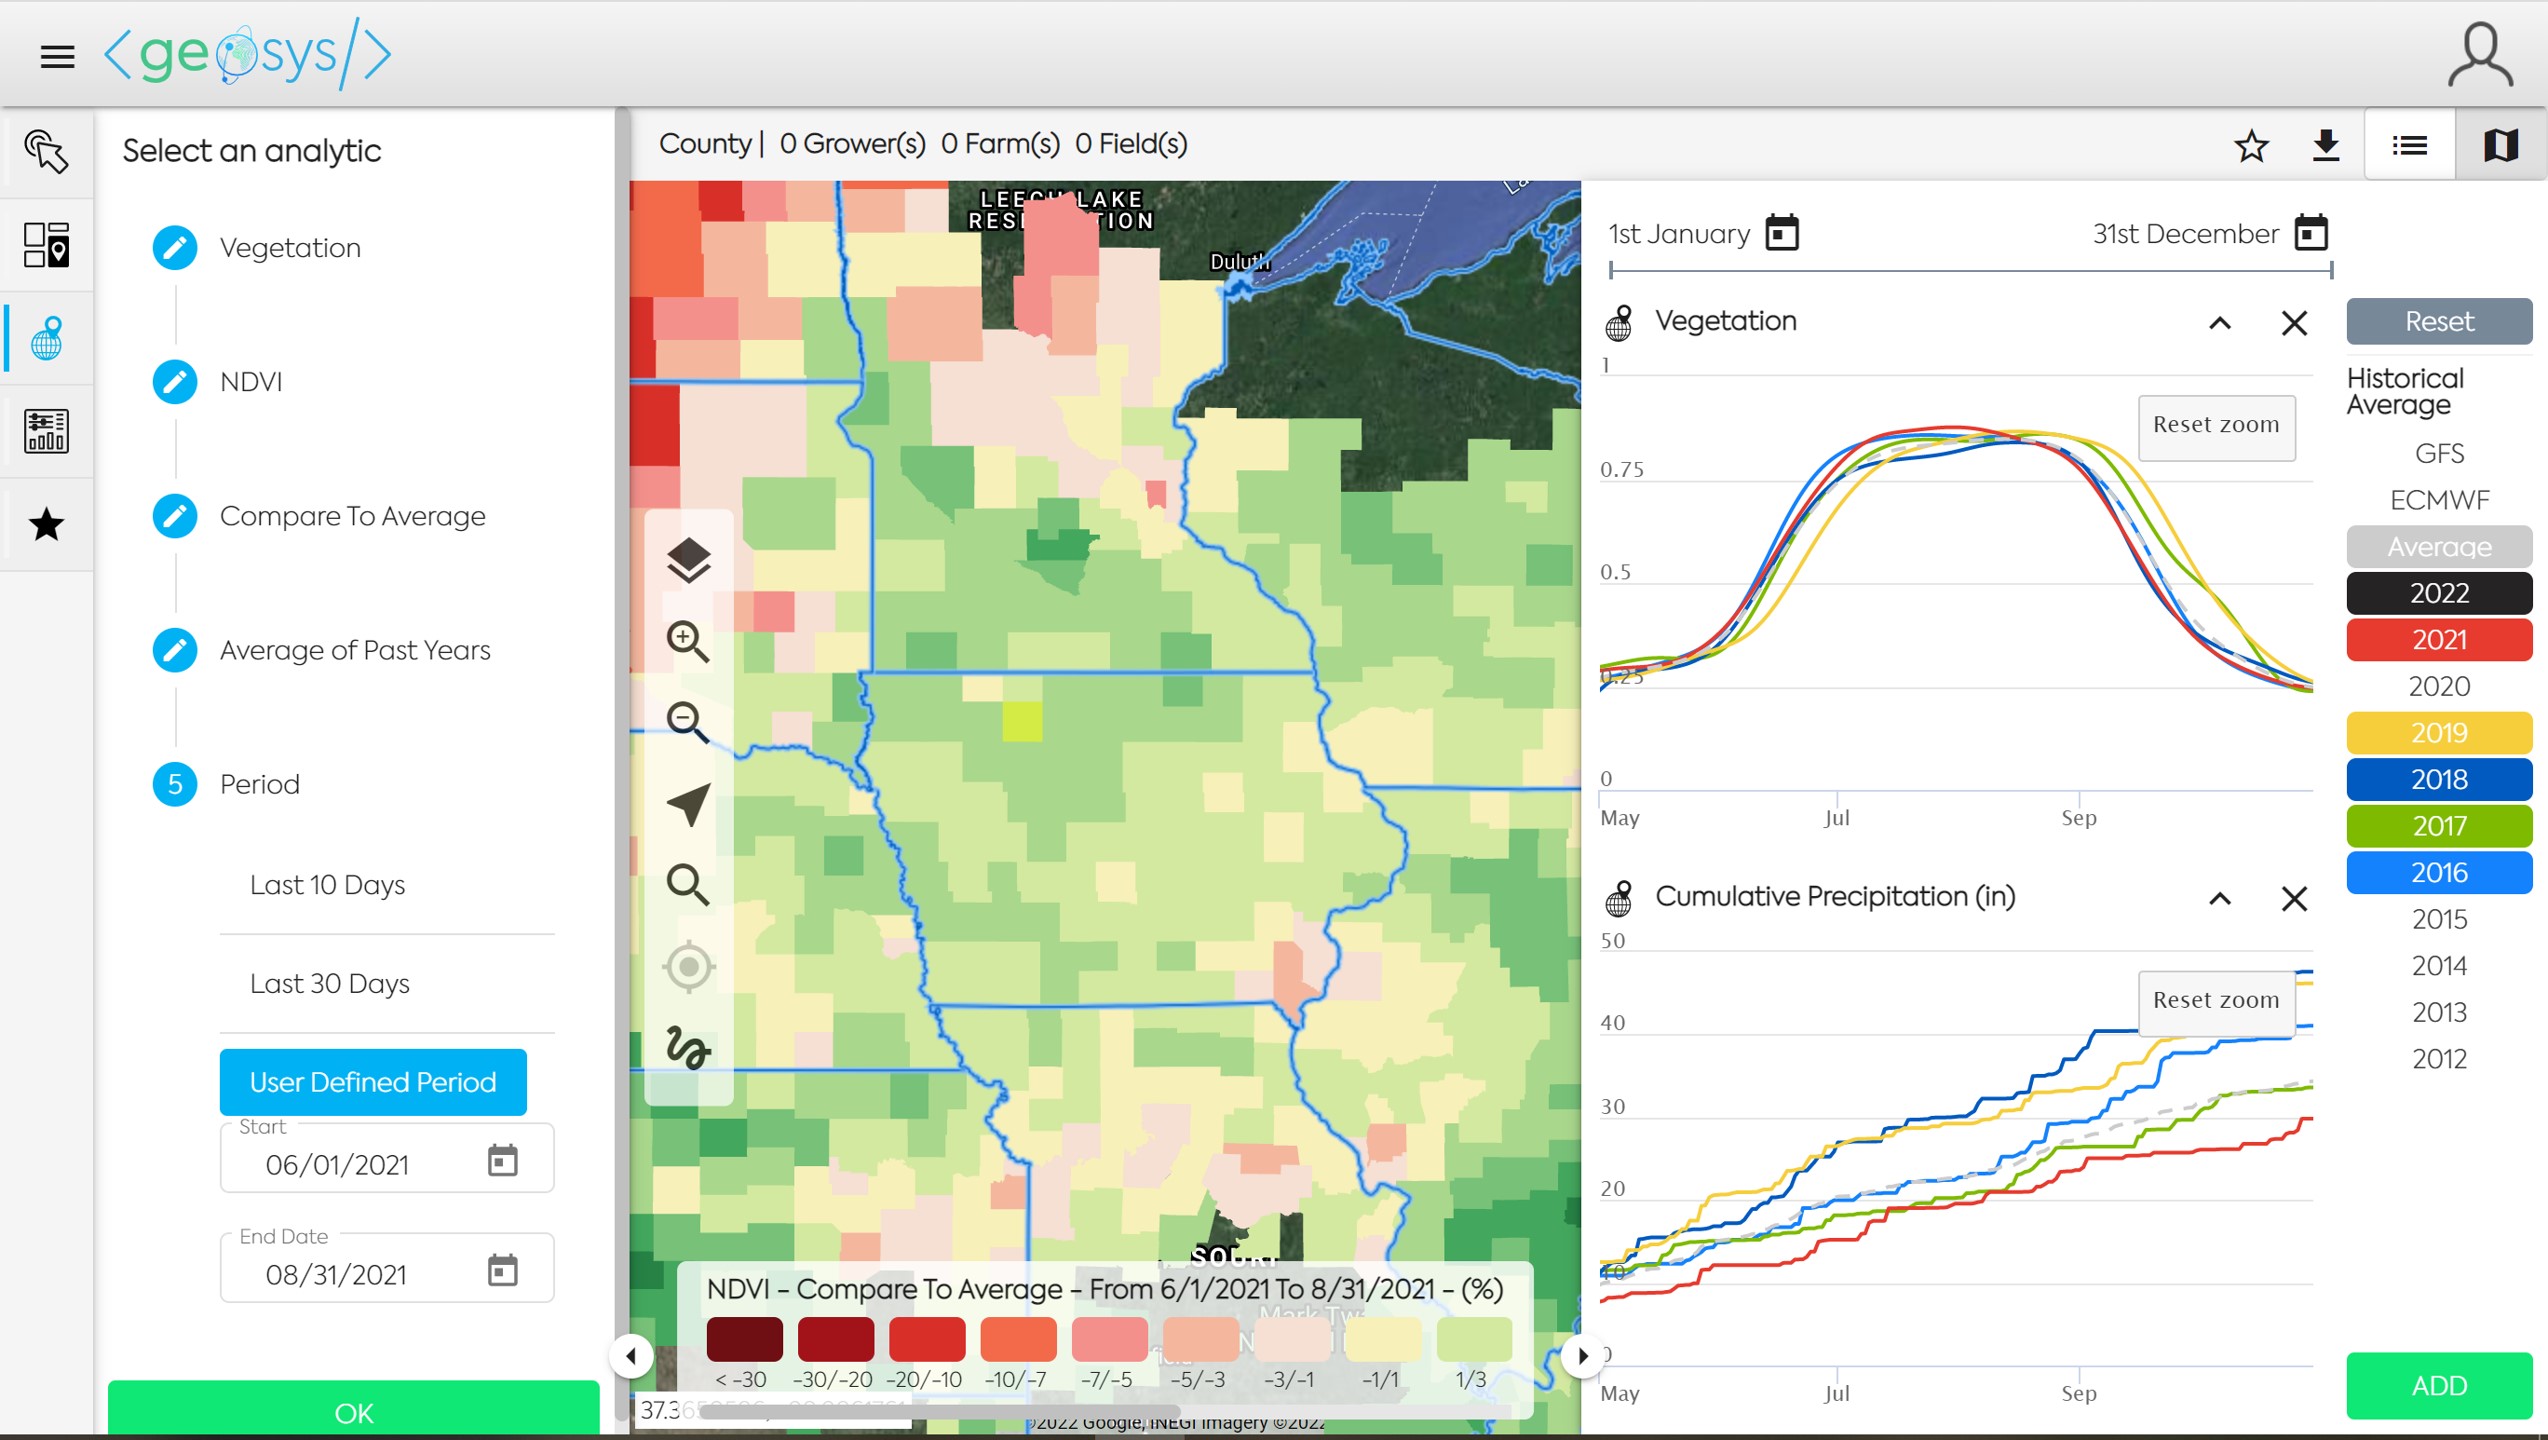
Add Time Series🔗
Add additional Time Series views to the panel by clicking the Add button in the bottom right of the panel and selecting the Analytic you wish to view.
📌 Favorite Maps🔗
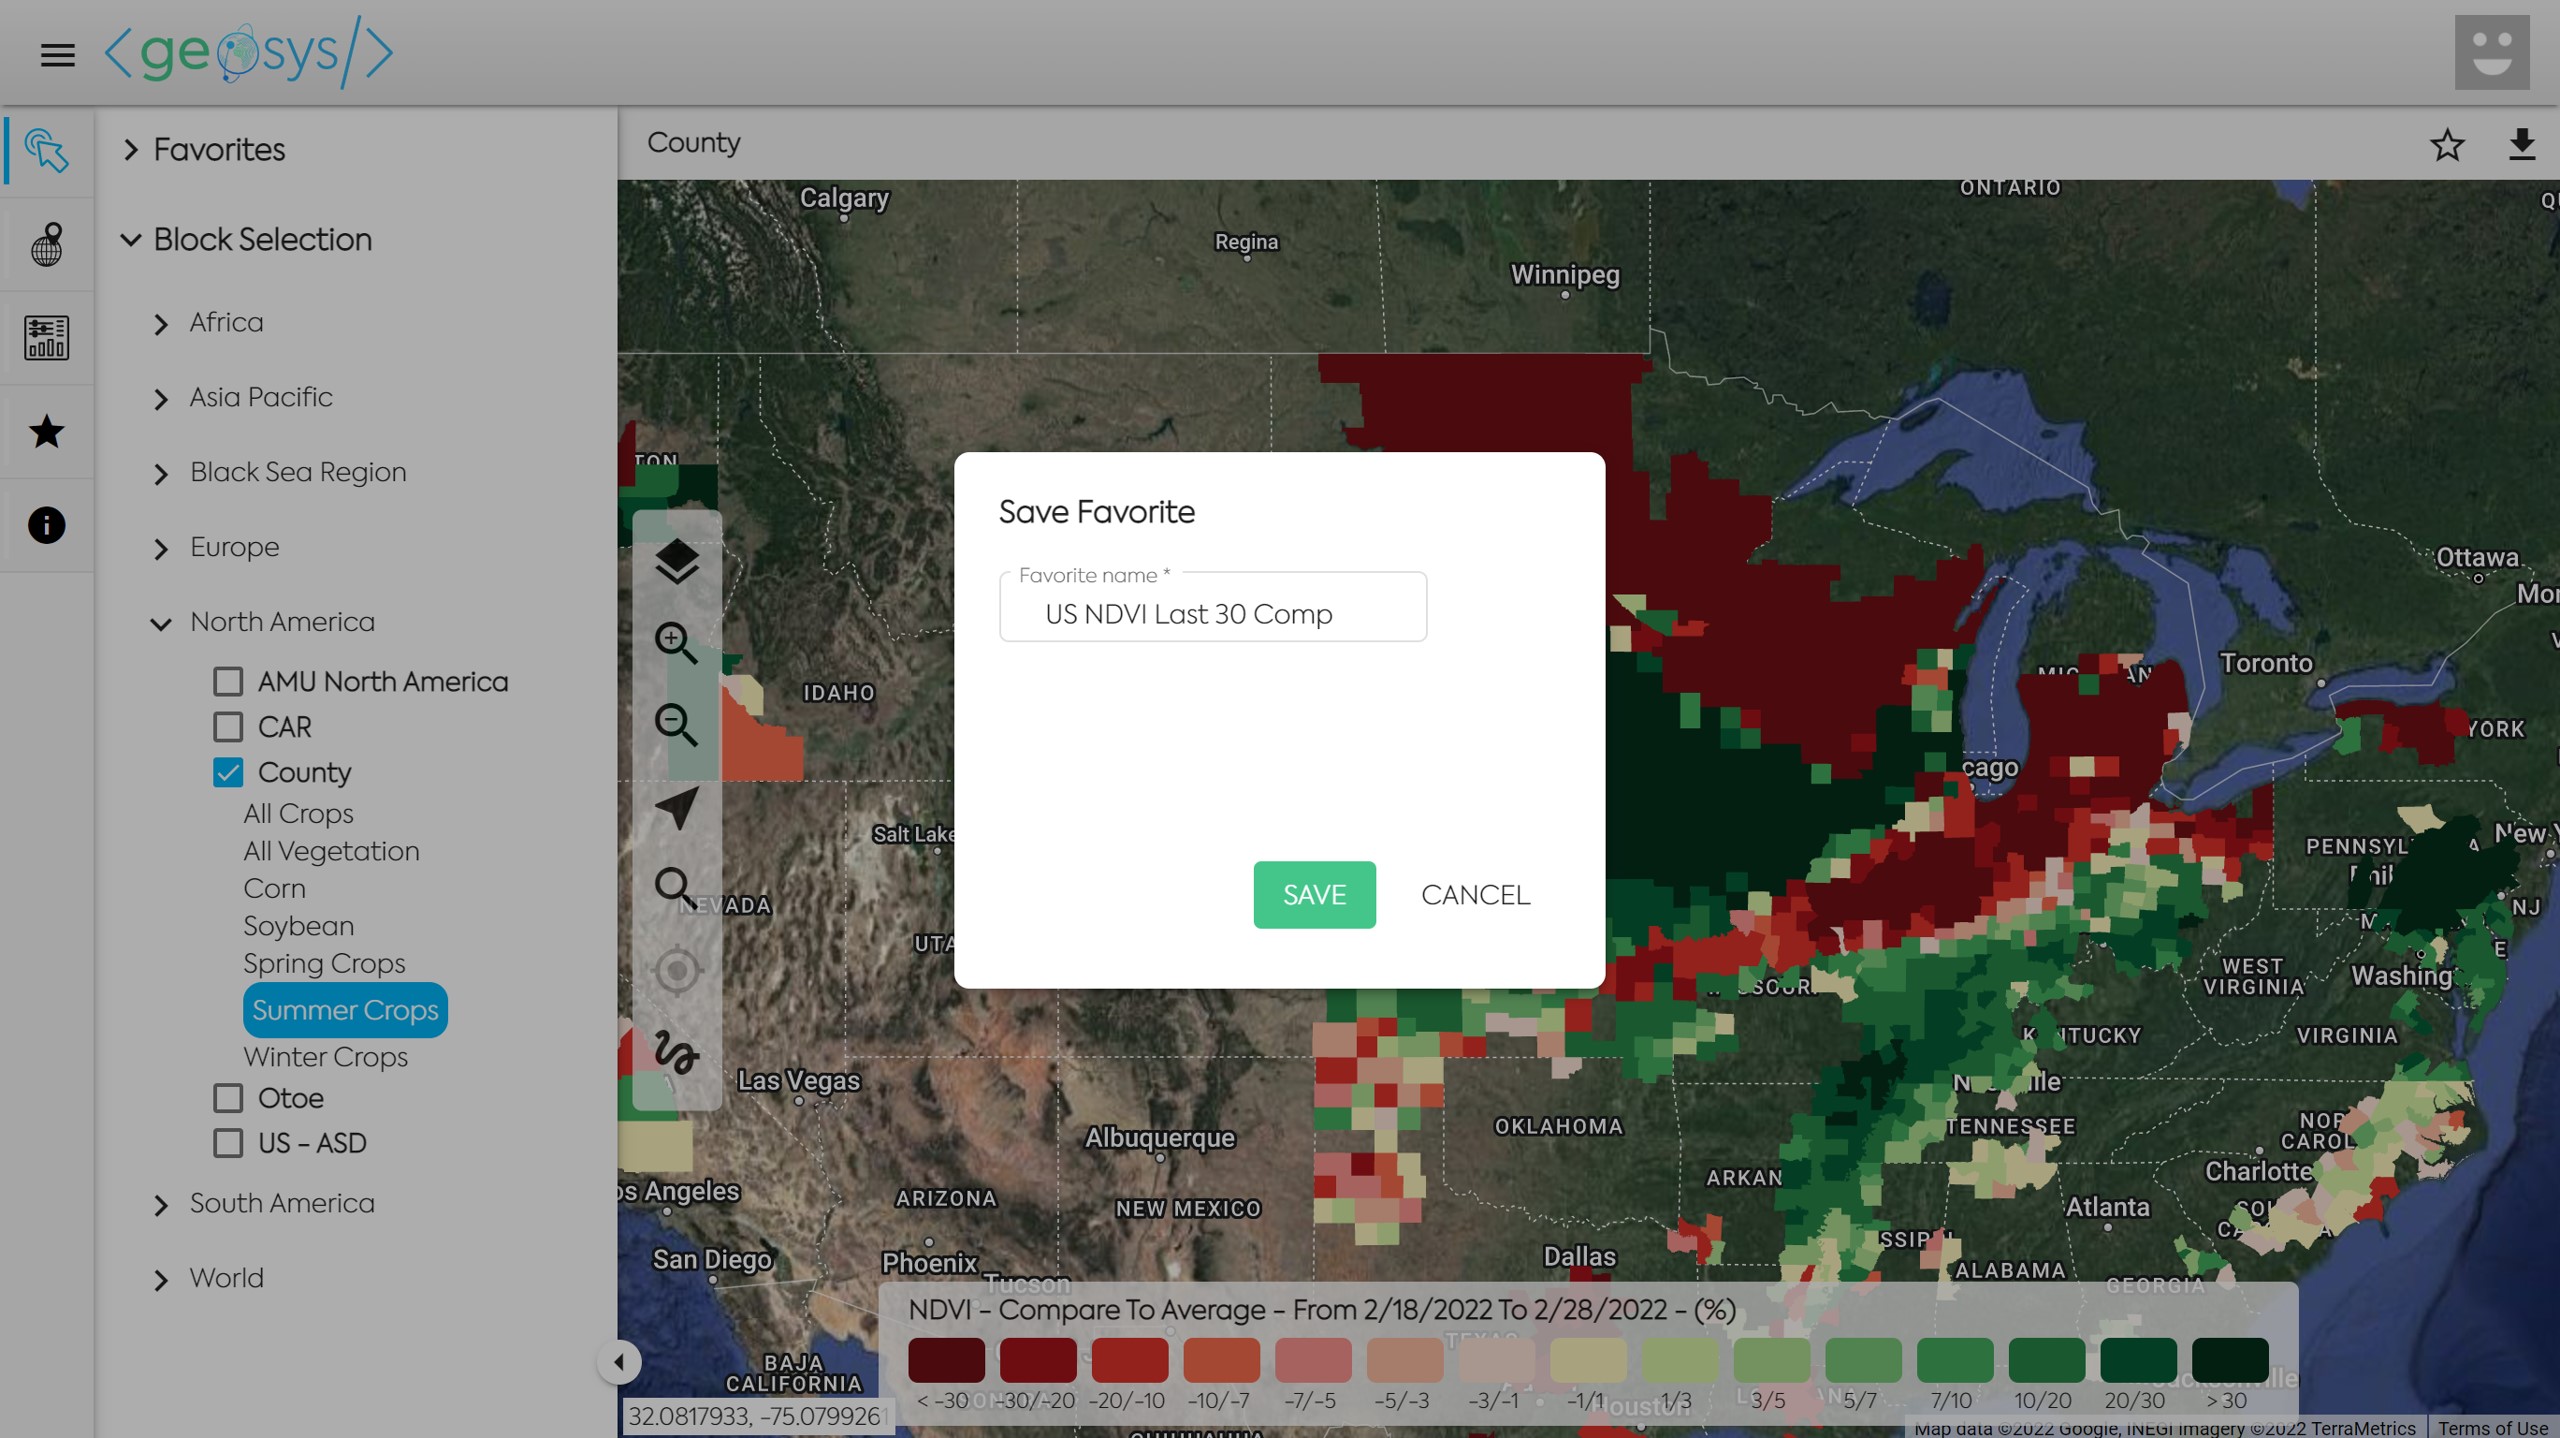
If you have a Regional Monitoring Map that you frequently visit you can save it as a Favorite so you do not need to select the Block, Mask and Analytic information each time you want to access the map. Once you have created the map you will need to click on the Star icon located in the top right of the screen.
Next you will choose a title for the Favorite Map and click Save.
Your Favorite Map can now be accessed through the quick selection at the top of the left panel.
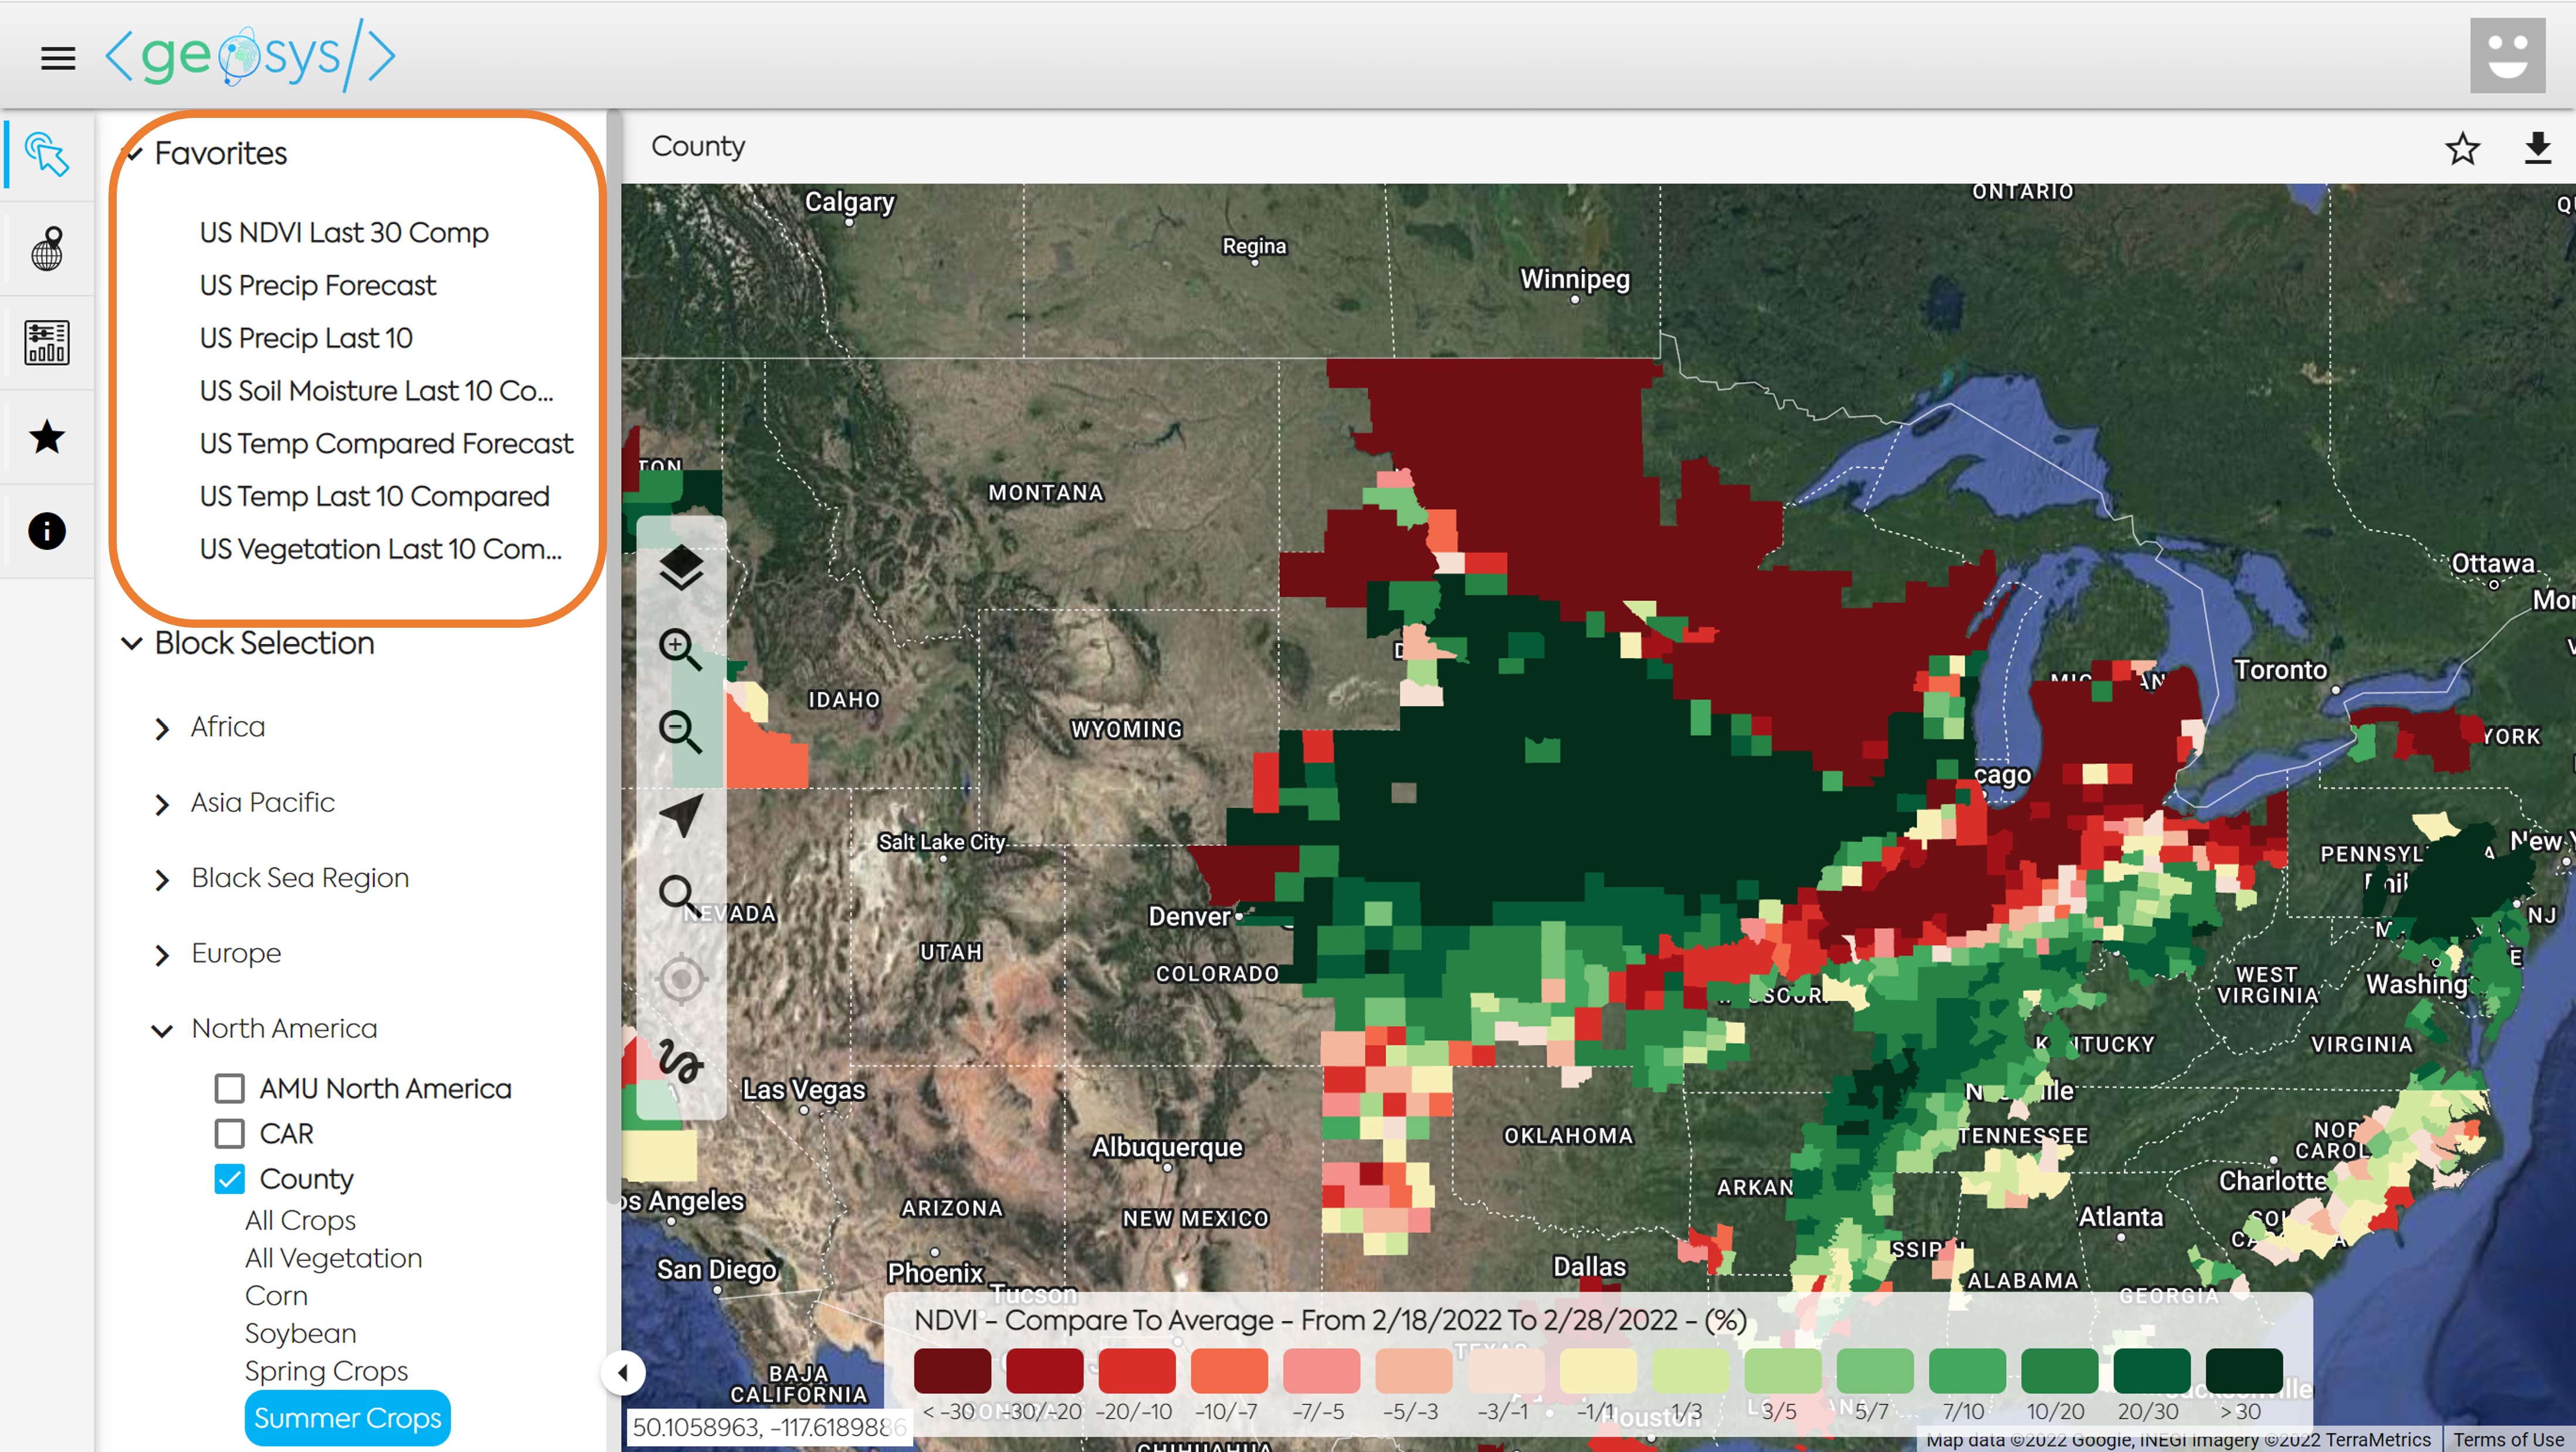
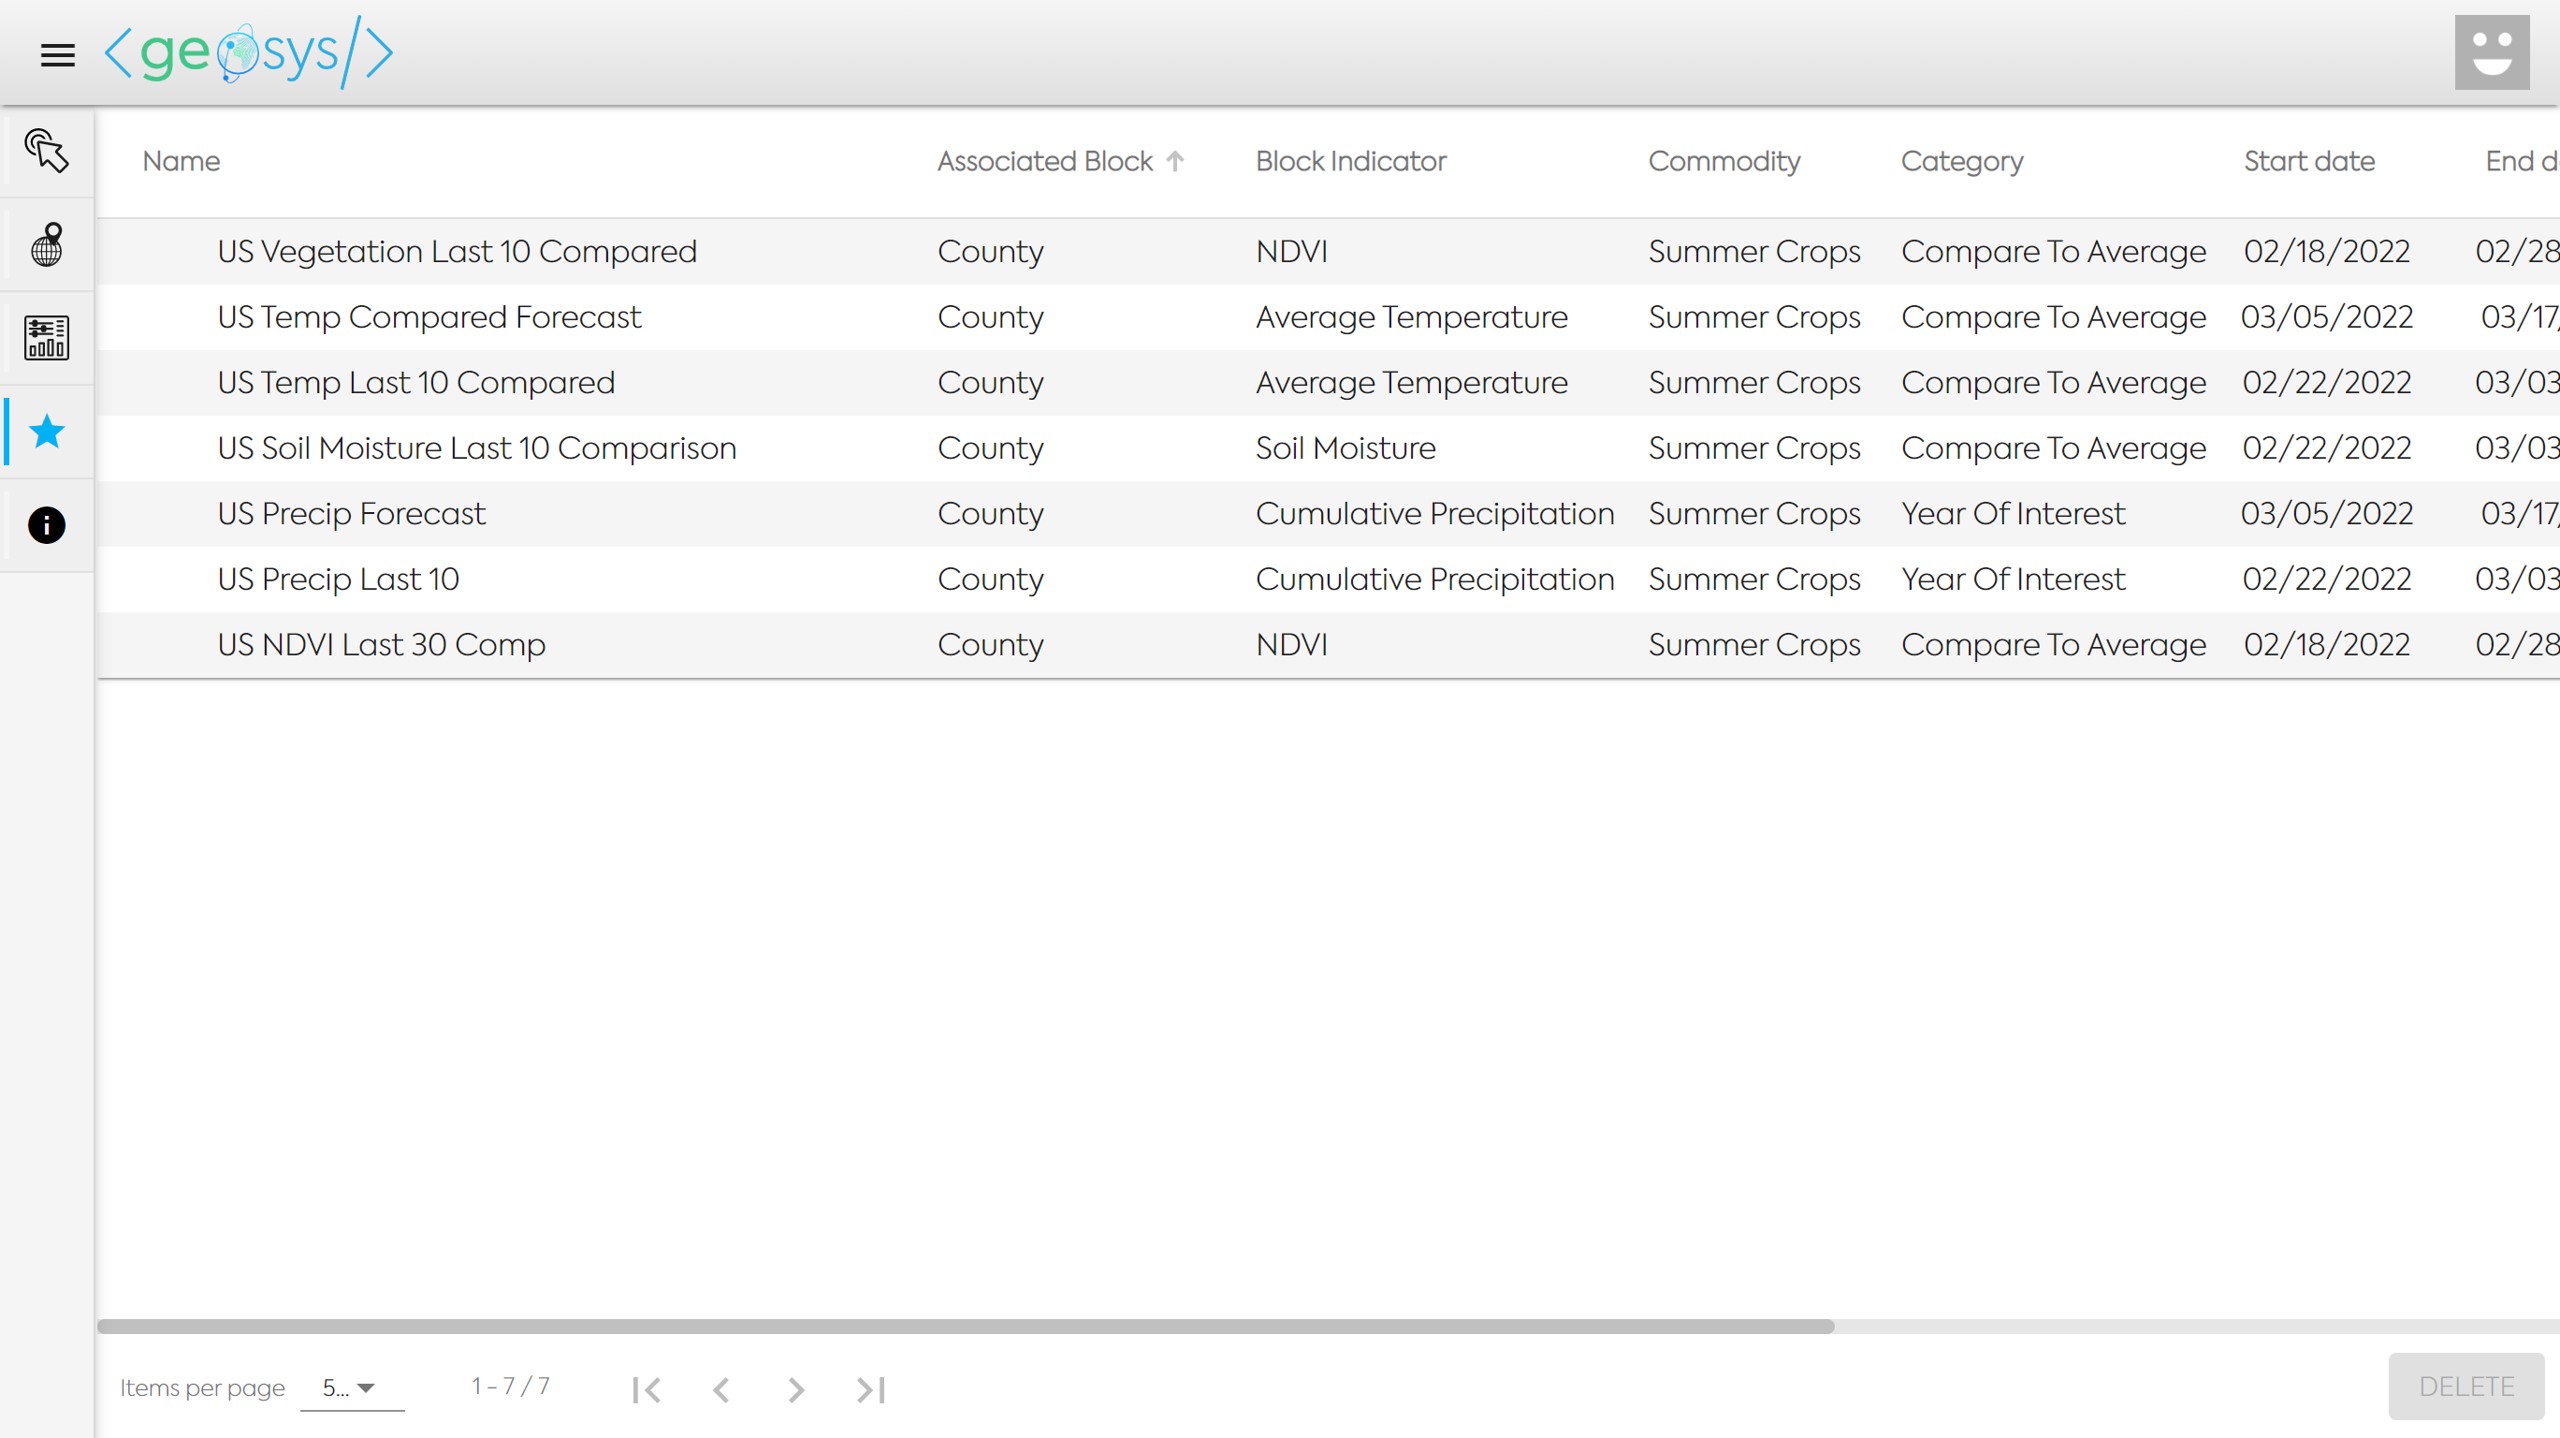
To see all parameters in each of the Favorites you can click on the Star icon in the far left panel.