Layer settings🔗
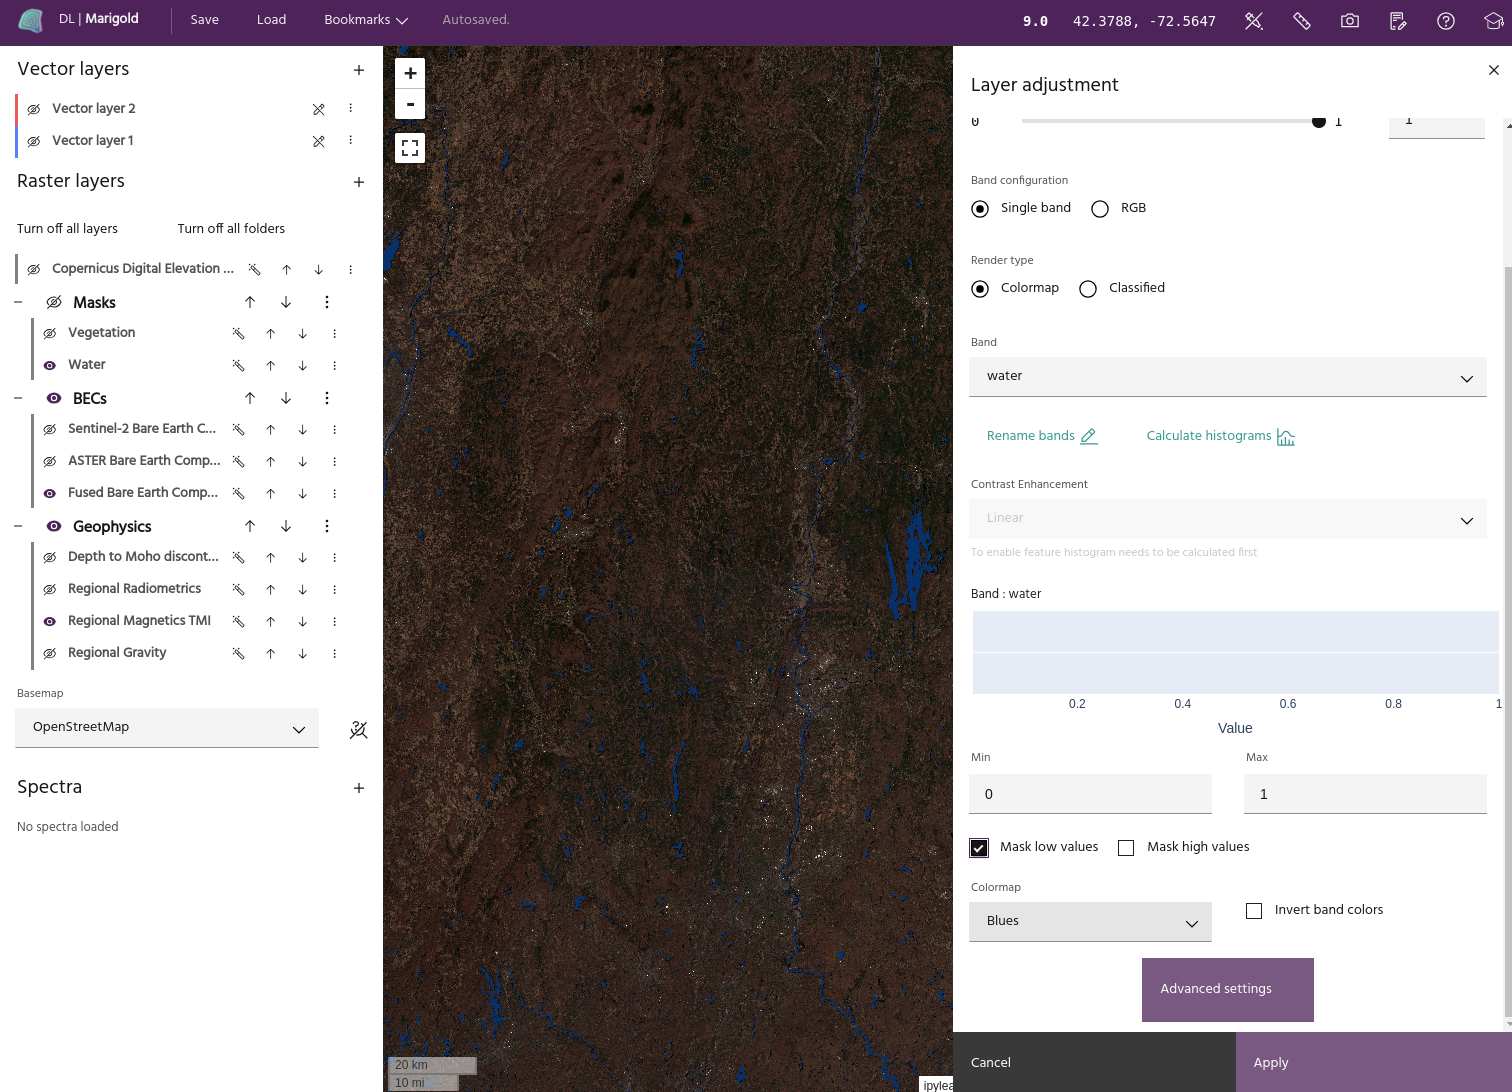
A layer's settings dialog offers many options for modifying properties of your layer.
Tip
The layer will update dynamically as you change settings, but you can always
undo your changes with the Cancel button!
Basic layer settings🔗
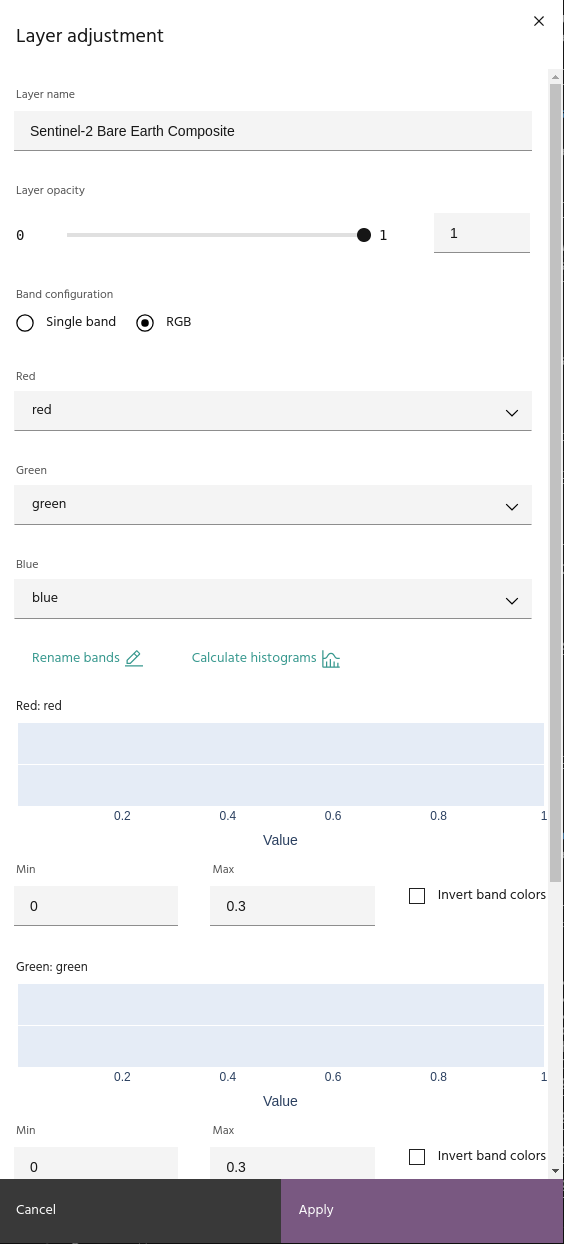
The first page of the dialog contains basic layer settings such as name, visible bands, and display contrast.
Rename a layer🔗
Click the Layer name text box in the Layer adjustment dialog box and edit the layer name. The name will change in the layer list automatically.
Adjust layer transparency🔗
Use the slider or text box to adjust the opacity of the layer (0 is completely transparent).
Date selection🔗
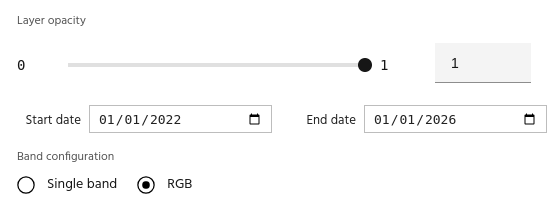
For layers that contain data from multiple dates, use the available selectors to set the start and end dates for the layer.
Tip
Layers derived from products with temporal settings can also have the date changed and will recompute using the new input data automatically.
Tip
For Hyperspectral data, the HSI image explorer can be used to explore images at individual dates.
Rename bands🔗
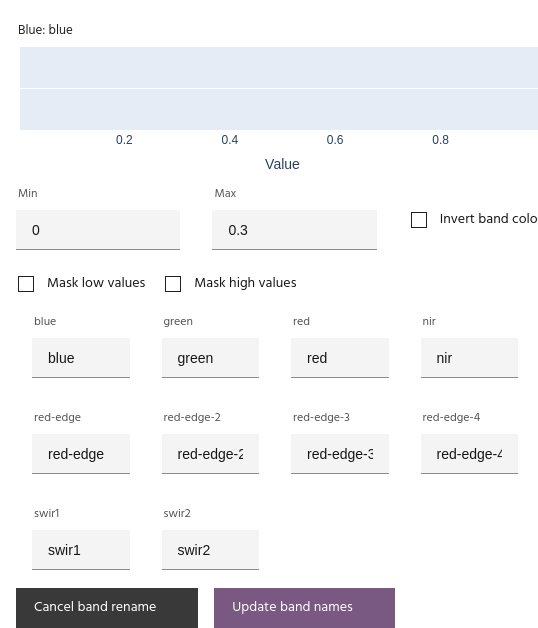
Click Rename bands. Use the text boxes to update band names, then click Update band names to save.
Calculate histograms🔗
Click Calculate histograms to see the distribution of values for each of the bands selected in the visualized channels. You can use this information to manually rescale the bands, use as a reference for custom expressions in the Raster calculator, or simply gain an understanding of the data distribution.
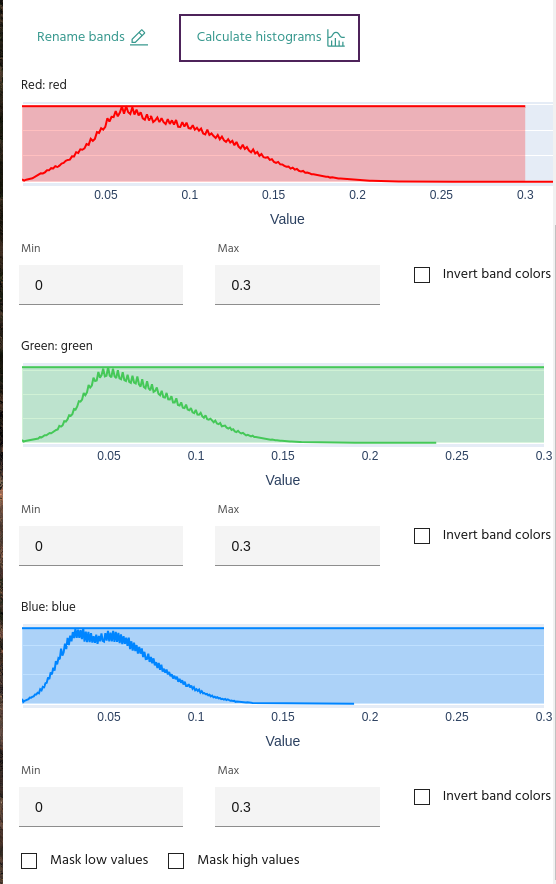
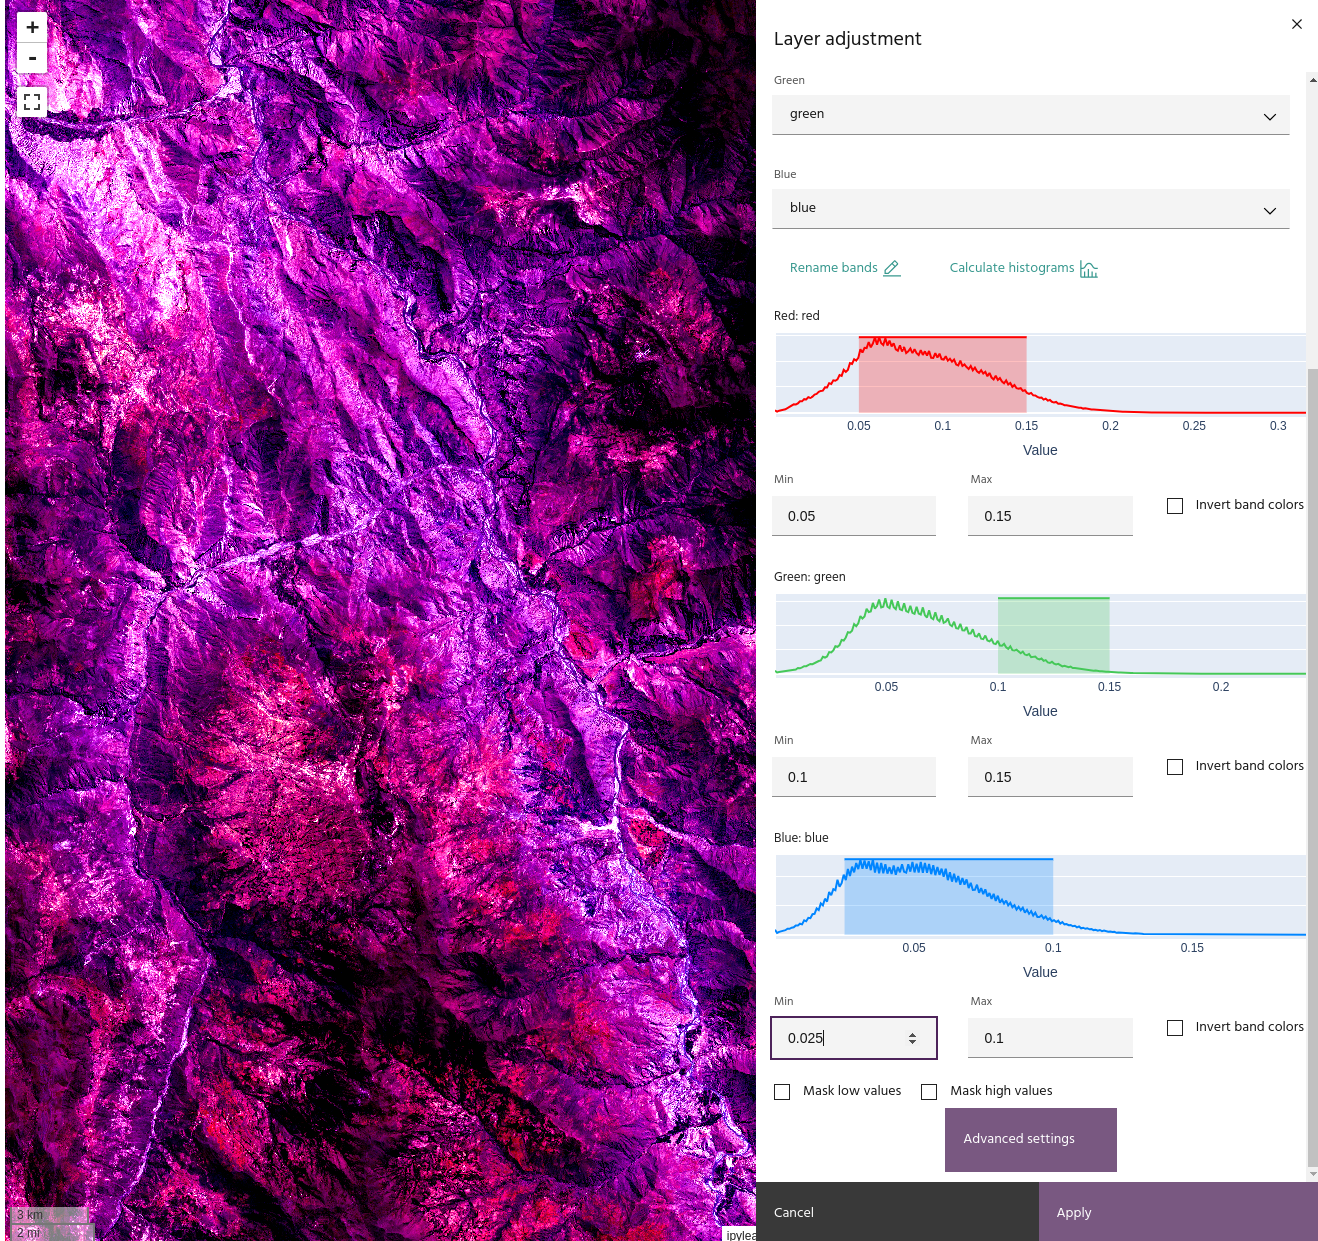
Rescale bands🔗
Use the Min and Max text boxes to enter the minimum and maximum values for the corresponding band. If you have histograms calculated, a shaded box covering the selected range will appear over the histogram.
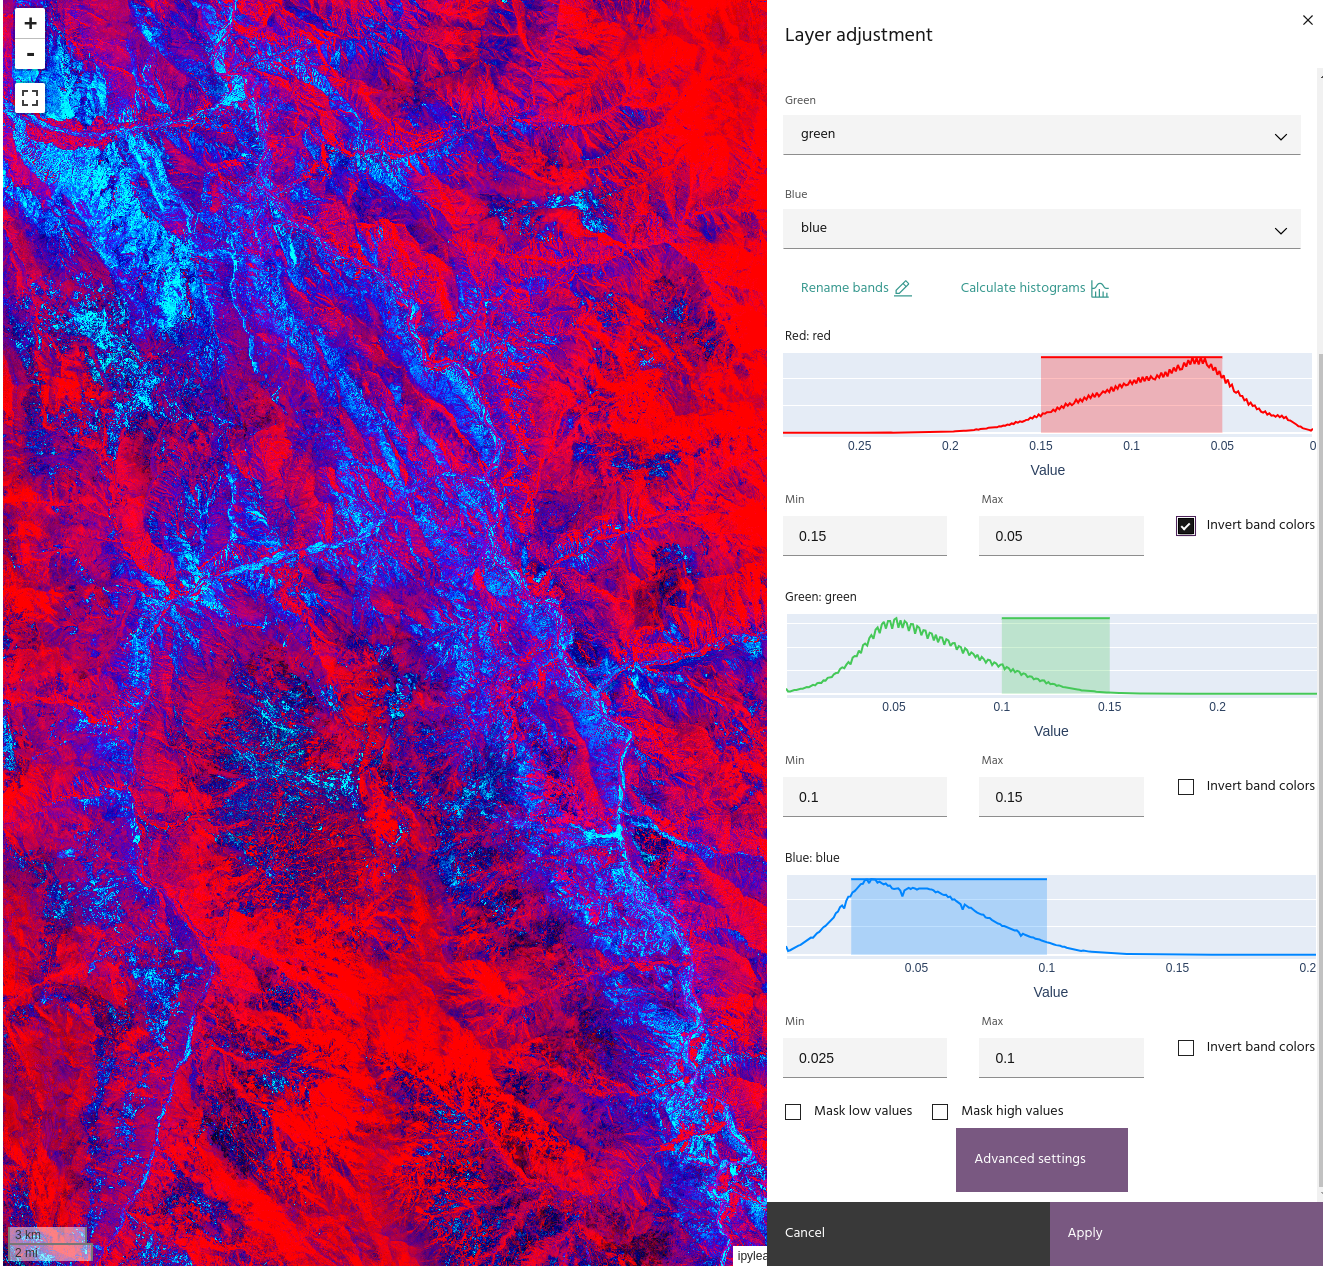
Selecting Invert band colors will display the data with the minimum value
as the brightest color instead of the darkest, and vice versa for the maximum.
Tip
When inverting a band, the histogram will display the "flipped" data.
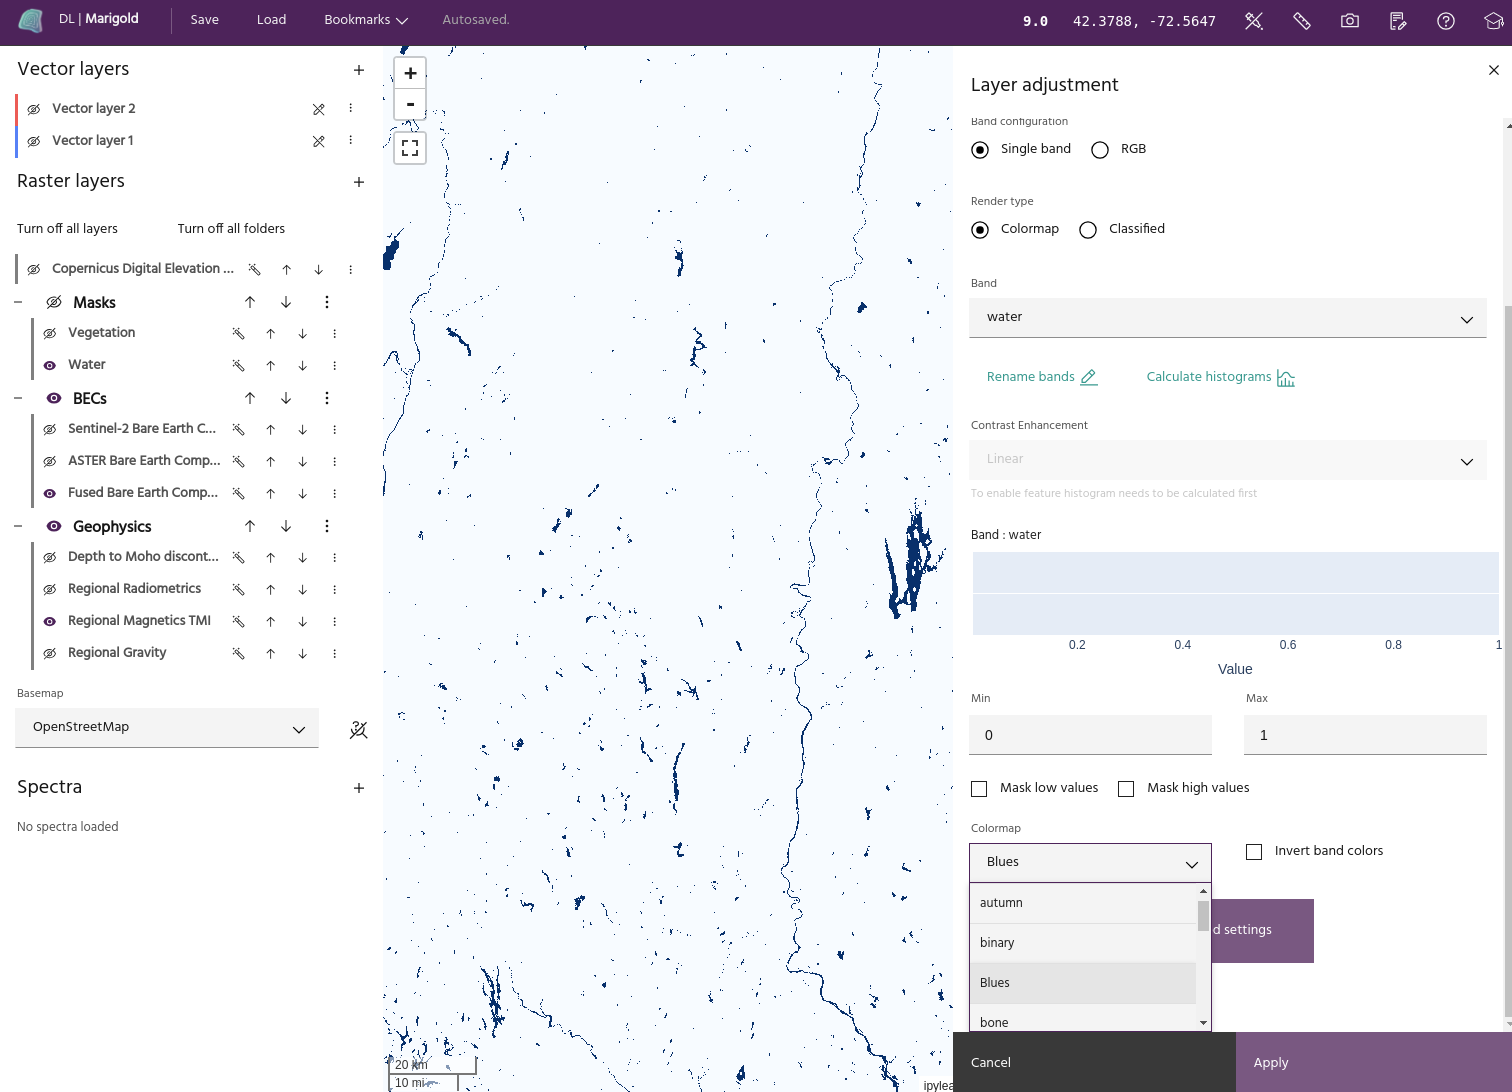
Apply a colormap to a layer🔗
Single band images are displayed using a colormap. Select Single band from the band configuration, and choose the desired band in the Band dropdown. Select the colormap you want to apply from the Colormap dropdown menu to display the band with that colormap.
Info
Marigold uses Matplotlib colormaps to display single band data. More information about these colormaps can be found here
Extrema masking🔗
Low and/or high values can be masked by selecting Mask low values and
Mask high values.
Tip
For RGB layers, masks will be applied when all bands values are outside of the limits. This has the effect of masking black pixels for low masking and white pixels for high masking.
Advanced layer settings🔗
Clicking the Advanced layer settings at the bottom of the dialog will bring
up advanced visualization options for the layer.
Warning
Advanced visualization settings are not yet available for Classified layers.
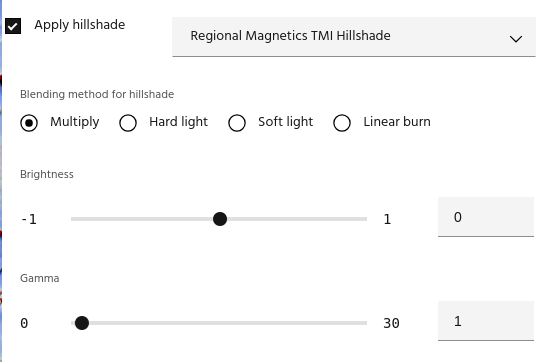
Apply hillshade to layer🔗
Note
Only layers created by the hillshade dialog can be used as a hillshade.
Once you have a hillshade layer in your project, you can apply it to a layer using several blending options:
- Multiply: simply multiply the hillshade and the base layer.
Tip
Since hillshade values are from 0-1, Multiply blending will always darken the base layer.
- Hard light: A combination of
Multiplyand its inverse that darkens low shade areas and brightens brighter ones.
- Soft light: A gentler combination of Multiply and its inverse, used for more subtle effects.
- Linear burn: Darkens the image by the brightness of the Hillshade
In addition, the hillshade itself can have its brightness or gamma adjusted using the sliders. The hillshade is adjusted by
before being applied using the chosen blend method.
Apply a layer as an Alpha band🔗
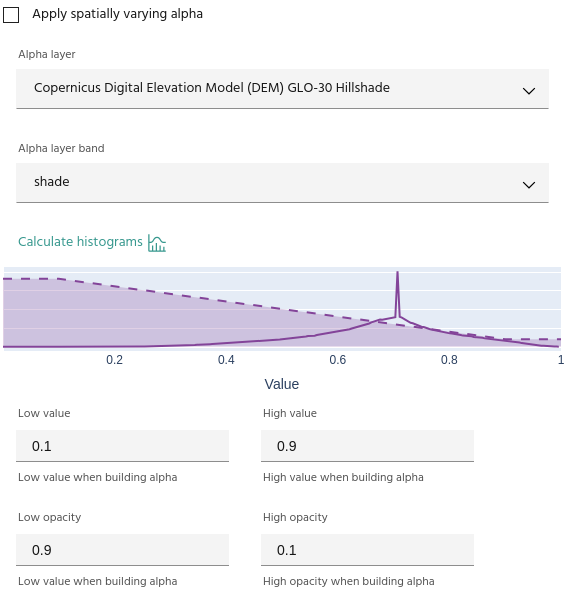
For more advanced displays, layers can be used as spatially-varying Alpha bands for other layers. To use a layer as an Alpha band:
- Choose a layer and band to use as an Alpha.
- Opacity values are defined using four points: the minimum/maximum opacity values, and the data values to which each corresponds.
Tip
Use the Compute histogram button to see the opacity curve over the data histogram.
If you have a hillshade applied to the layer, you can apply the Alpha band to the hillshade instead of the layer. This has the effect of bringing back the brightness that can be lost when using blending modes like Multiply.